© nmisa 2010 platinum resistance thermometers: converting ohms to degrees celsius hans liedberg
TRANSCRIPT

© NMISA 2010
Platinum resistance thermometers: converting ohms to degrees Celsius
Hans LIEDBERG
© NMISA 2010
Overview
If converting resistance to temperature by hand, remember:
• PRTs are not all that linear.
If using a readout that calculates temperature for you,
remember:
• PRTs come in different sensitivities.
© NMISA 2010
Resistance-temperature relationship of a PRT
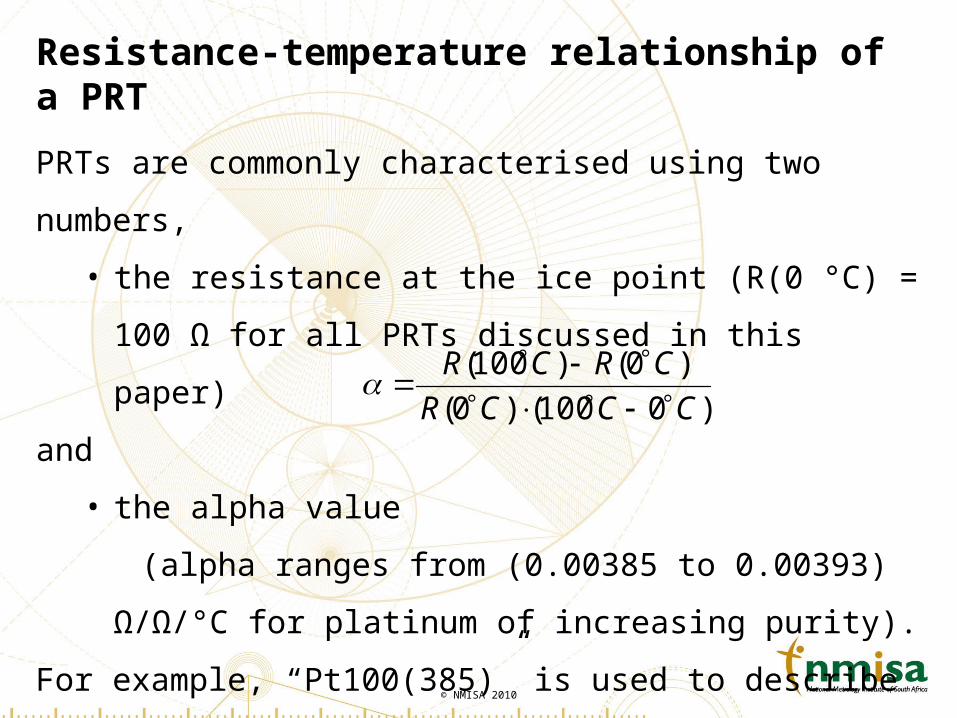
PRTs are commonly characterised using two numbers,
• the resistance at the ice point (R(0 °C) = 100 Ω for all
PRTs discussed in this paper)
and
• the alpha value
(alpha ranges from (0.00385 to 0.00393) Ω/Ω/°C for
platinum of increasing purity).
For example, “Pt100(385)” is used to describe a 100 Ω PRT
with alpha = 0.00385 Ω/Ω/°C.
)0100()0(
)0()100(
CCCR
CRCR
© NMISA 2010
Resistance-temperature relationship of a PRT (cntd)
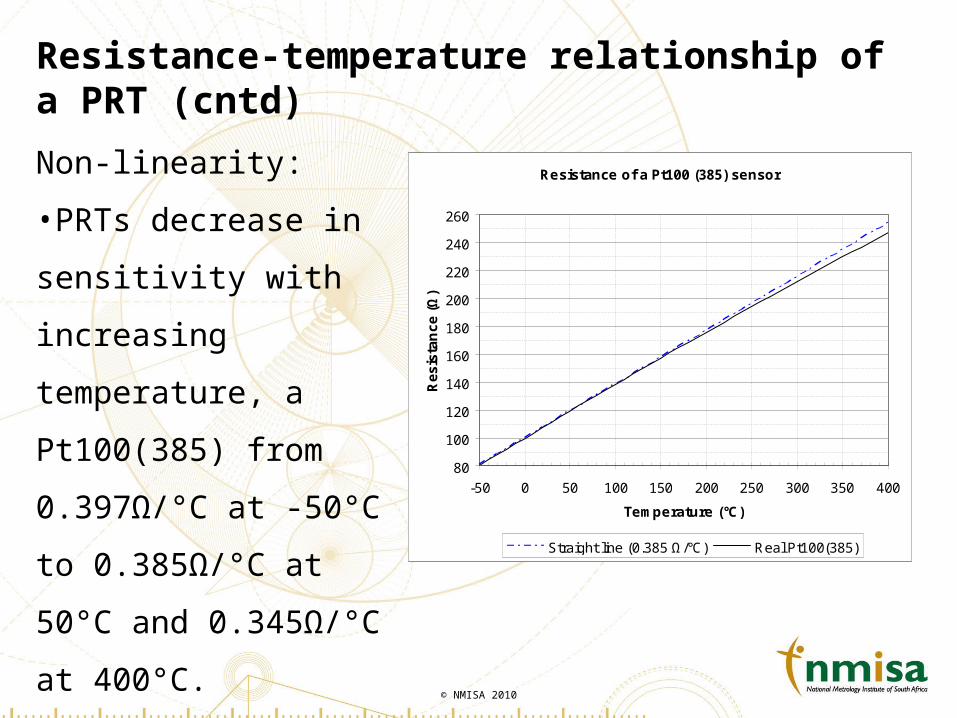
Non-linearity:
•PRTs decrease in
sensitivity with increasing
temperature, a
Pt100(385) from
0.397Ω/°C at -50°C to
0.385Ω/°C at 50°C and
0.345Ω/°C at 400°C.
Resistance of a Pt100 (385) sensor
80
100
120
140
160
180
200
220
240
260
-50 0 50 100 150 200 250 300 350 400
Temperature (°C)
Re
sis
tan
ce
(Ω
)
Straight line (0.385 Ω/°C) Real Pt100(385)
© NMISA 2010
Resistance-temperature relationship of a PRT (cntd)
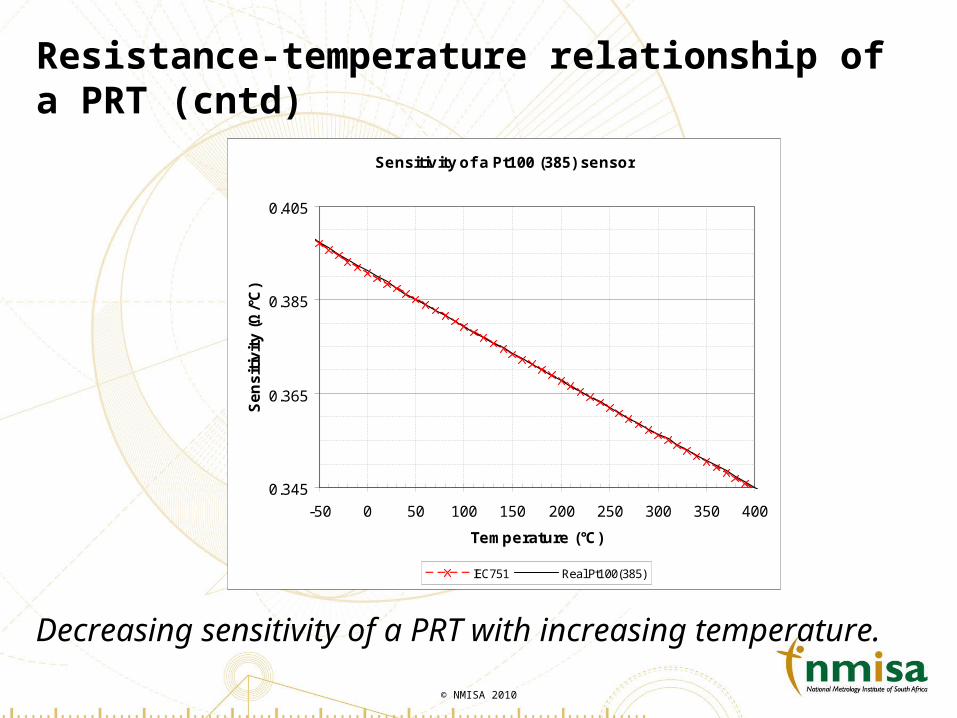
Decreasing sensitivity of a PRT with increasing temperature.
Sensitivity of a Pt100 (385) sensor
0.345
0.365
0.385
0.405
-50 0 50 100 150 200 250 300 350 400
Temperature (°C)
Se
ns
itiv
ity
(Ω
/°C
)
IEC751 Real Pt100(385)
© NMISA 2010
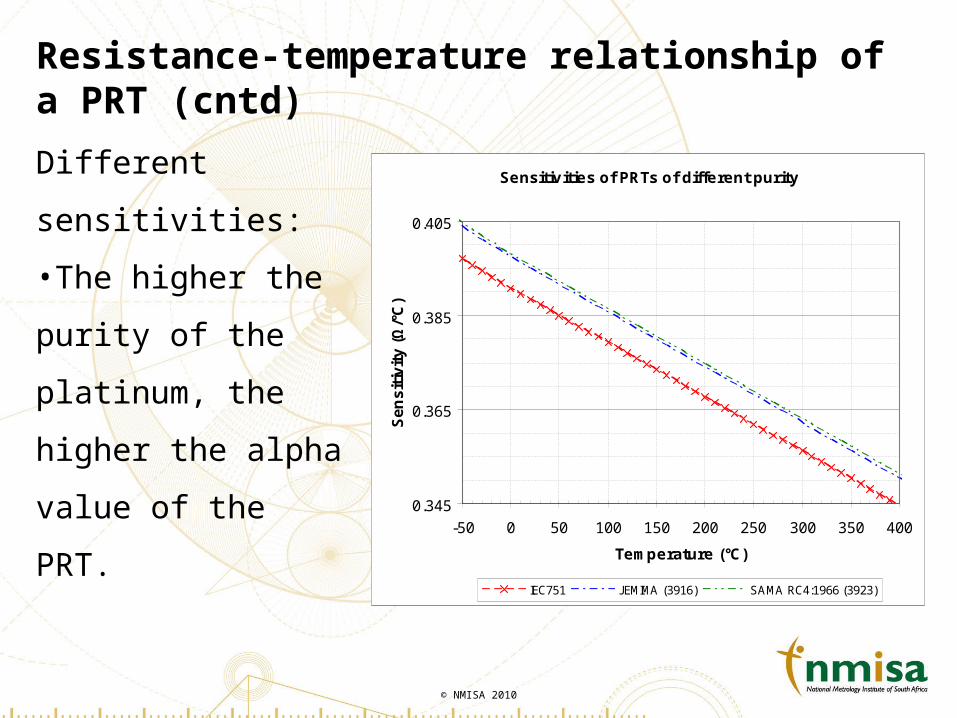
Resistance-temperature relationship of a PRT (cntd)
Different sensitivities:
•The higher the purity
of the platinum, the
higher the alpha
value of the PRT.
Sensitivities of PRTs of different purity
0.345
0.365
0.385
0.405
-50 0 50 100 150 200 250 300 350 400
Temperature (°C)
Se
ns
itiv
ity
(Ω
/°C
)
IEC751 JEMIMA (3916) SAMA RC4:1966 (3923)
© NMISA 2010
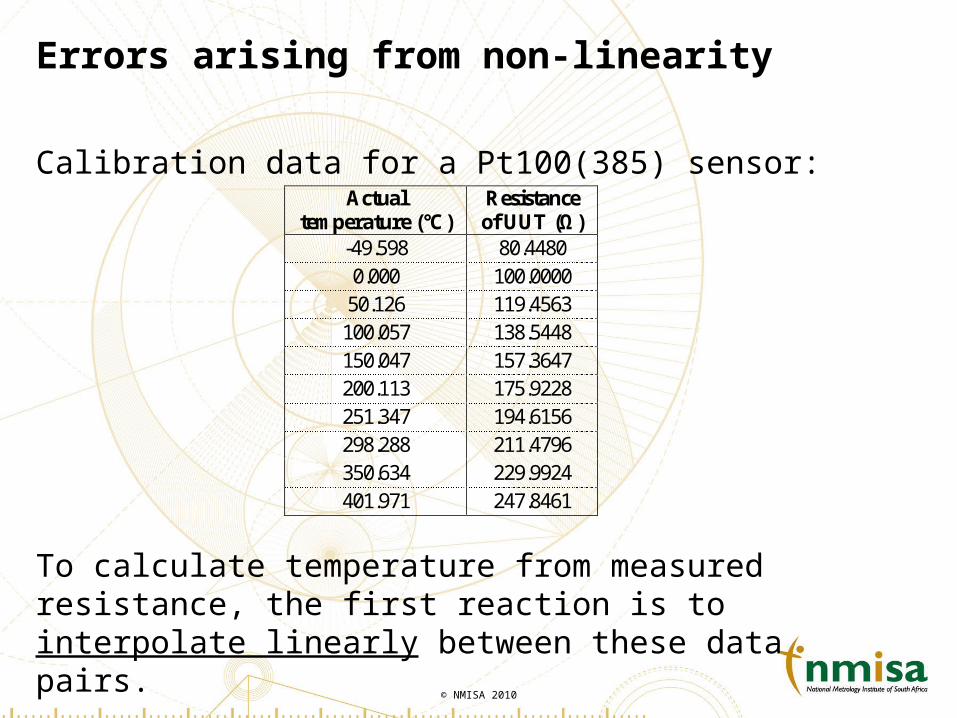
Errors arising from non-linearity
Calibration data for a Pt100(385) sensor:Actual
temperature (°C) Resistance of UUT (Ω)
-49.598 80.4480 0.000 100.0000 50.126 119.4563 100.057 138.5448 150.047 157.3647 200.113 175.9228 251.347 194.6156 298.288 211.4796 350.634 229.9924 401.971 247.8461
To calculate temperature from measured resistance, the first reaction is to interpolate linearly between these data pairs.
© NMISA 2010
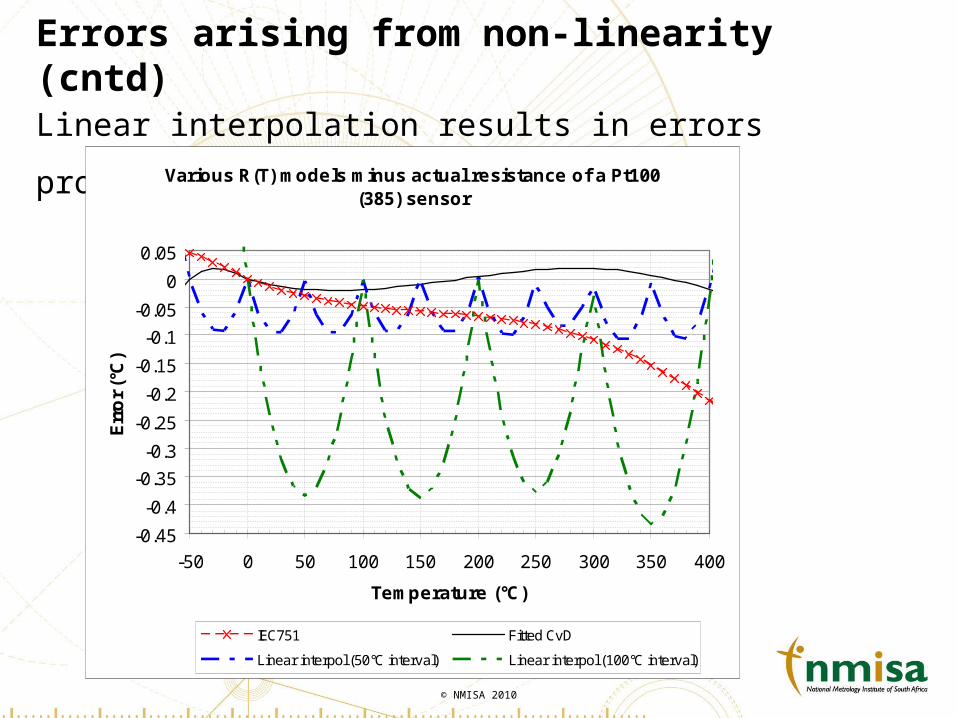
Errors arising from non-linearity (cntd)
Linear interpolation results in errors proportional to ΔT2:Various R(T) models minus actual resistance of a Pt100
(385) sensor
-0.45
-0.4
-0.35
-0.3
-0.25
-0.2
-0.15
-0.1
-0.05
0
0.05
-50 0 50 100 150 200 250 300 350 400
Temperature (°C)
Err
or
(°C
)
IEC751 Fitted CvD
Linear interpol (50°C interval) Linear interpol (100°C interval)

© NMISA 2010
Solutions to the non-linearity problem
1. Use a reference function that models the decreasing
sensitivity of PRTs with increasing temperature well (e.g., ITS-
90 or IEC 751).
• The deviations of a real PRT from such a reference
function should be fairly linear.
OR
2. Fit a 2nd order polynomial to the data (e.g., using Excel’s
“Add trendline” function).
© NMISA 2010
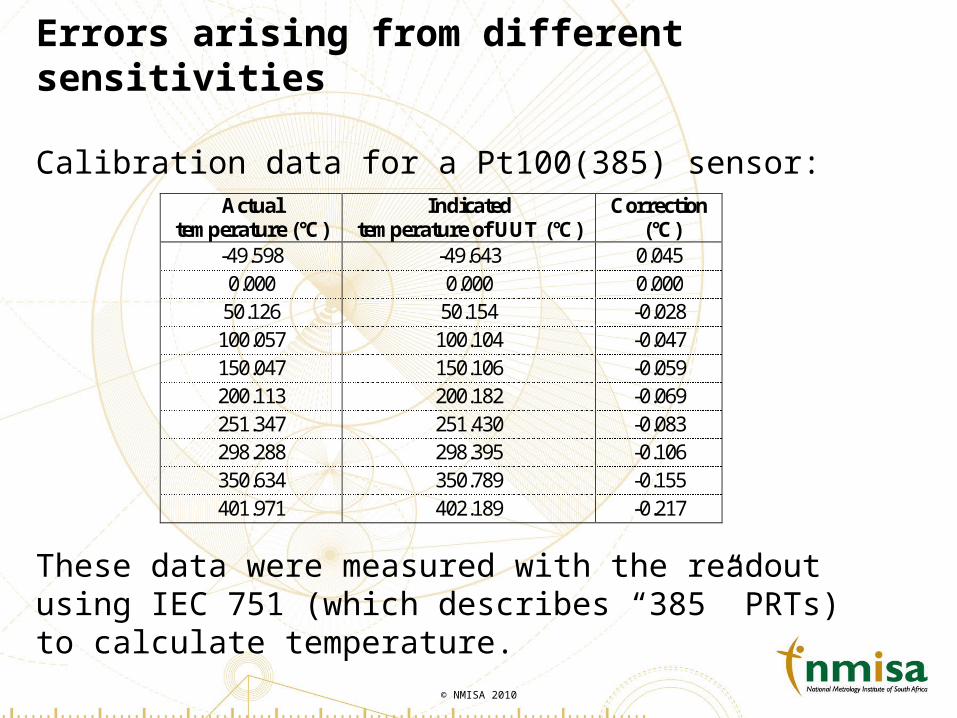
Errors arising from different sensitivities
Calibration data for a Pt100(385) sensor:
These data were measured with the readout using IEC 751 (which describes “385” PRTs) to calculate temperature.
Actual temperature (°C)
Indicated temperature of UUT (°C)
Correction (°C)
-49.598 -49.643 0.045 0.000 0.000 0.000
50.126 50.154 -0.028 100.057 100.104 -0.047 150.047 150.106 -0.059 200.113 200.182 -0.069 251.347 251.430 -0.083 298.288 298.395 -0.106 350.634 350.789 -0.155 401.971 402.189 -0.217
© NMISA 2010
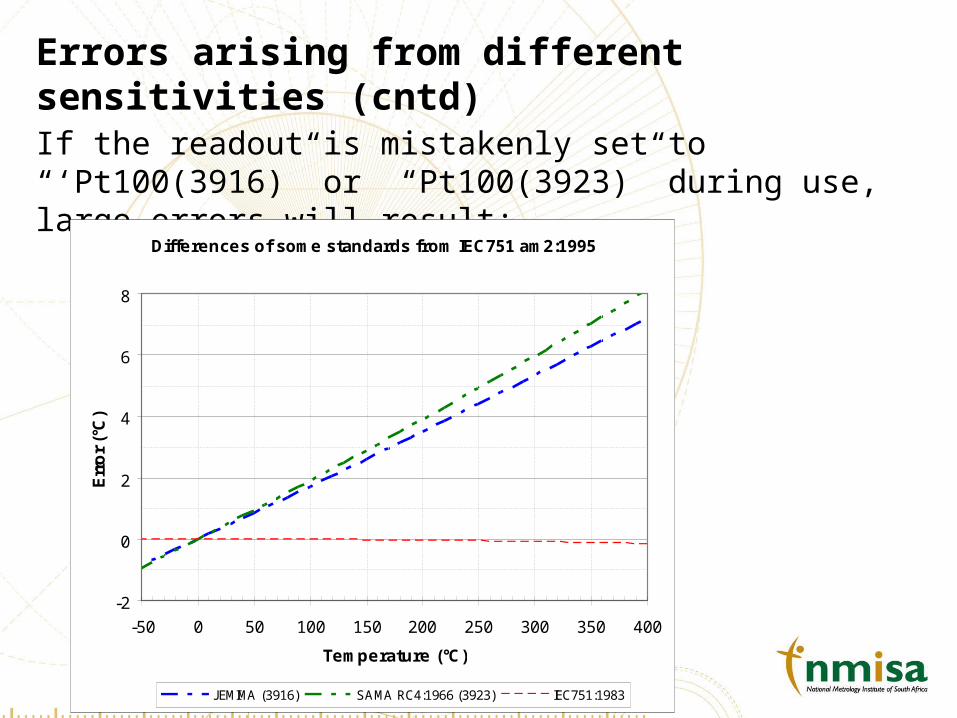
Errors arising from different sensitivities (cntd)If the readout is mistakenly set to “‘Pt100(3916)” or “Pt100(3923)” during use, large errors will result:
Differences of some standards from IEC751 am2:1995
-2
0
2
4
6
8
-50 0 50 100 150 200 250 300 350 400
Temperature (°C)
Err
or
(°C
)
JEMIMA (3916) SAMA RC4:1966 (3923) IEC751:1983
© NMISA 2010
Verifying the readout sensitivity setting
•Checking the PRT + readout system at the ice point only
verifies that R(0°C) or R(0.01°C) is correct.
•To verify A, B and C coefficients, check the system at a
temperature away from 0°C, using
• a simple fixed point (e.g., boiling point of water or
sublimation point of carbon dioxide)
or
• a PRT + readout system for which the correct resistance-
to-temperature conversion method is not in doubt.
© NMISA 2010
Conclusions
PRTs capable of ±0.01°C accuracy are readily available. To
achieve this, take care to
• use an appropriate method to interpolate between
resistance-temperature data pairs
or
• set your readout to the same function as was used
during calibration.
Cal lab and client should agree on the method of resistance-
temperature conversion during contract review.