: neutron inelastic scattering
TRANSCRIPT
Structural phase transition in deuterated benzil C14D10O2: Neutron inelastic scattering
D. J. Goossens* and T. R. WelberryResearch School of Chemistry, The Australian National University, Canberra 0200, Australia
M. E. HagenSpallation Neutron Source, Oak Ridge National Laboratory, P.O. Box 2008, Tennessee 37831, USA
J. A. Fernandez-BacaCenter for Neutron Scattering, Oak Ridge National Laboratory, P.O. Box 2008, Tennessee 37831, USA
�Received 9 January 2006; published 26 April 2006�
Neutron inelastic scattering has been used to examine the structural phase transition in deuterated benzilC14D10O2. The transition in benzil, in which the unit cell goes from a trigonal P3121 unit cell above TC to acell doubled P21 unit cell below TC, leads to the emergence of a Bragg peak at the M-point of the hightemperature Brillouin zone. It has previously been suggested that the softening of a transverse optic phonon atthe �-point leads to the triggering of an instability at the M-point causing the transition to occur. Thissuggestion has been investigated by measuring the phonon spectrum at the M-point for a range of temperaturesabove TC and the phonon dispersion relation along the �-M direction just above TC. It is found that thetransverse acoustic phonon at the M-point is of lower energy than the �-point optic mode and has a softeningwith temperature as T approaches TC from above that is much faster than that of the �-point optic mode. Thisbehavior is inconsistent with the view that the �-point mode is responsible for triggering the phase transition.Rather the structural phase transition in benzil appears to be driven by a conventional soft TA mode at theM-point.
DOI: 10.1103/PhysRevB.73.134116 PACS number�s�: 68.35.Rh, 63.20.Dj, 61.12.�q
I. INTRODUCTION
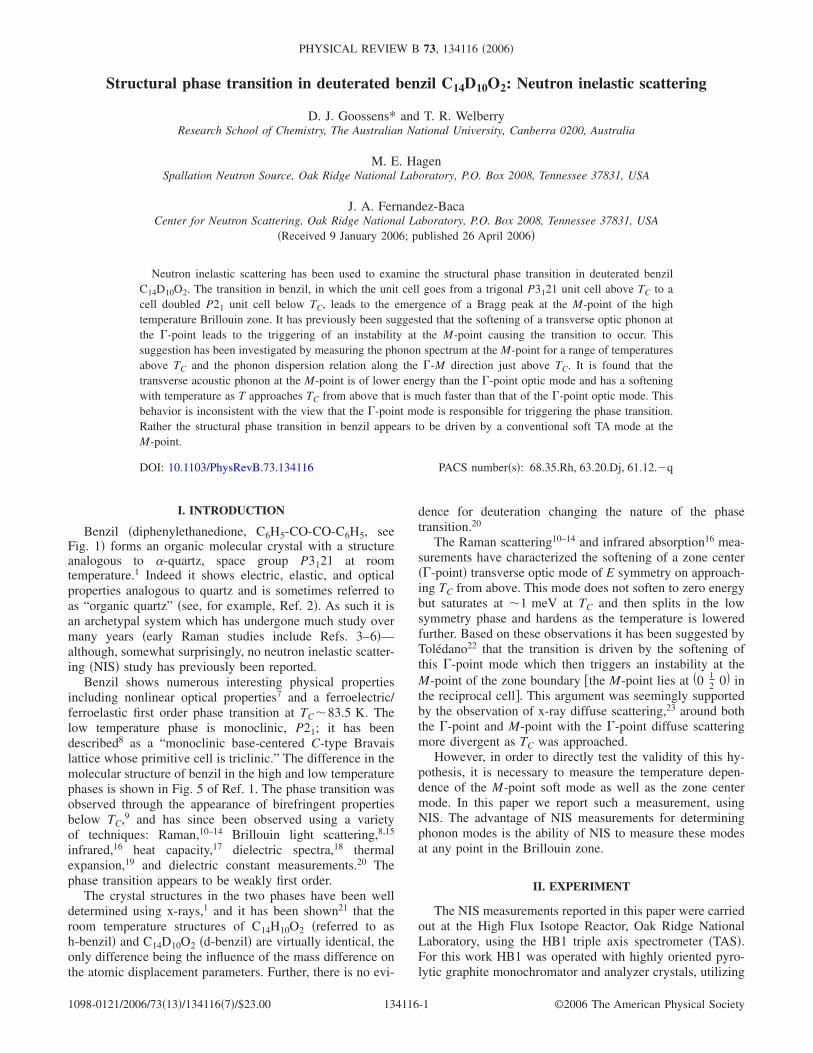
Benzil �diphenylethanedione, C6H5-CO-CO-C6H5, seeFig. 1� forms an organic molecular crystal with a structureanalogous to �-quartz, space group P3121 at roomtemperature.1 Indeed it shows electric, elastic, and opticalproperties analogous to quartz and is sometimes referred toas “organic quartz” �see, for example, Ref. 2�. As such it isan archetypal system which has undergone much study overmany years �early Raman studies include Refs. 3–6�—although, somewhat surprisingly, no neutron inelastic scatter-ing �NIS� study has previously been reported.
Benzil shows numerous interesting physical propertiesincluding nonlinear optical properties7 and a ferroelectric/ferroelastic first order phase transition at TC�83.5 K. Thelow temperature phase is monoclinic, P21; it has beendescribed8 as a “monoclinic base-centered C-type Bravaislattice whose primitive cell is triclinic.” The difference in themolecular structure of benzil in the high and low temperaturephases is shown in Fig. 5 of Ref. 1. The phase transition wasobserved through the appearance of birefringent propertiesbelow TC,9 and has since been observed using a varietyof techniques: Raman,10–14 Brillouin light scattering,8,15
infrared,16 heat capacity,17 dielectric spectra,18 thermalexpansion,19 and dielectric constant measurements.20 Thephase transition appears to be weakly first order.
The crystal structures in the two phases have been welldetermined using x-rays,1 and it has been shown21 that theroom temperature structures of C14H10O2 �referred to ash-benzil� and C14D10O2 �d-benzil� are virtually identical, theonly difference being the influence of the mass difference onthe atomic displacement parameters. Further, there is no evi-
dence for deuteration changing the nature of the phasetransition.20
The Raman scattering10–14 and infrared absorption16 mea-surements have characterized the softening of a zone center��-point� transverse optic mode of E symmetry on approach-ing TC from above. This mode does not soften to zero energybut saturates at �1 meV at TC and then splits in the lowsymmetry phase and hardens as the temperature is loweredfurther. Based on these observations it has been suggested byTolédano22 that the transition is driven by the softening ofthis �-point mode which then triggers an instability at theM-point of the zone boundary �the M-point lies at �0 1
2 0� inthe reciprocal cell�. This argument was seemingly supportedby the observation of x-ray diffuse scattering,23 around boththe �-point and M-point with the �-point diffuse scatteringmore divergent as TC was approached.
However, in order to directly test the validity of this hy-pothesis, it is necessary to measure the temperature depen-dence of the M-point soft mode as well as the zone centermode. In this paper we report such a measurement, usingNIS. The advantage of NIS measurements for determiningphonon modes is the ability of NIS to measure these modesat any point in the Brillouin zone.
II. EXPERIMENT
The NIS measurements reported in this paper were carriedout at the High Flux Isotope Reactor, Oak Ridge NationalLaboratory, using the HB1 triple axis spectrometer �TAS�.For this work HB1 was operated with highly oriented pyro-lytic graphite monochromator and analyzer crystals, utilizing
PHYSICAL REVIEW B 73, 134116 �2006�
1098-0121/2006/73�13�/134116�7�/$23.00 ©2006 The American Physical Society134116-1
the �002� reflection planes to scatter the beam. A fixed finalenergy of EF=14.7 meV was used throughout the measure-ments which allowed for the use of a pyrolytic graphite filterin the scattered beam in order to reduce the amount of � /2contamination �see, Ref. 24�. The Soller collimation em-ployed was 48� of arc before the monochromator, 20� be-tween monochromator and sample, and again betweensample and analyzer, and 48� between the analyzer and de-tector. This combination of collimation and fixed analyzingenergy led to an energy resolution of 0.49 meV FWHM asmeasured using the incoherent elastic scattering from a stan-dard vanadium rod sample.
The sample used was a single crystal of d-benzil withdimensions of 16 mm�8 mm�6 mm where the long axiswas, to a close approximation, the hexagonal c axis. In thispaper we use a hexagonal unit cell notation for benzil withlattice parameters at room temperatures of a=8.376 Å andc=13.70 Å. The sample was mounted with its c-axis verticalinside a sealed sample can containing helium as an exchangegas. This can was attached to the copper block of a closedcycle refrigerator that was in turn mounted on the sampletable of the HB1 TAS. As a consequence the horizontal scat-tering plane of the HB1 TAS allowed us to perform measure-ments at wave vectors in the �h ,k ,0� plane in reciprocalspace.
The closed cycle refrigerator allowed us to control thetemperature of the sample between room temperature and90 K. It should be noted that the transition temperature ofd-benzil is 88.1 K and that, since the transition is first order,the crystal could not reversably be driven through the phasetransition. For the measurements reported in this paper thetemperatures were stable to ±0.06 K.
III. RESULTS
The principal aim of this work has been to examine thetemperature dependence of the lowest energy �TA� phonon ind-benzil at the M-point of the high temperature Brillouinzone. Since the 88.1 K �Ref. 20� structural phase transitionin d-benzil �and the equivalent 83.5 K transition in h-benzil�leads to the appearance of a Bragg peak at the M-point itseems reasonable to expect the M-point TA mode to showsoftening as a function of temperature on approaching TC. Inorder to characterize this softening we have performed
constant-Q inelastic measurements at the �4,−0.5,0�M-point at various temperatures from 93 to 152 K. Measure-ments were restricted to the range T�90 K.
A complete set of the low energy phonon dispersionrelations were surveyed along the �4,−� ,0� �-M directionfrom �4,0 ,0� � to �4,−0.5,0� M at 100 K. Within thel=0 plane the reciprocal space of benzil has sixfold symme-try, for example, directions such as �4+� ,−� ,0� are equiva-lent to �4,−� ,0�. However, for planes with l�0 the truethreefold symmetry of benzil becomes apparent and it is the�4,−� , l�0� direction that remains as a symmetry direction.It should be noted that in the x-ray diffuse scattering mea-surements a strong line of diffuse scattering is seen along�4,−� ,0� while the line along �4+� ,−� ,0� is weak.25,26
FIG. 1. Schematic diagram of the benzil molecule. �i are theinternal degrees of freedom.
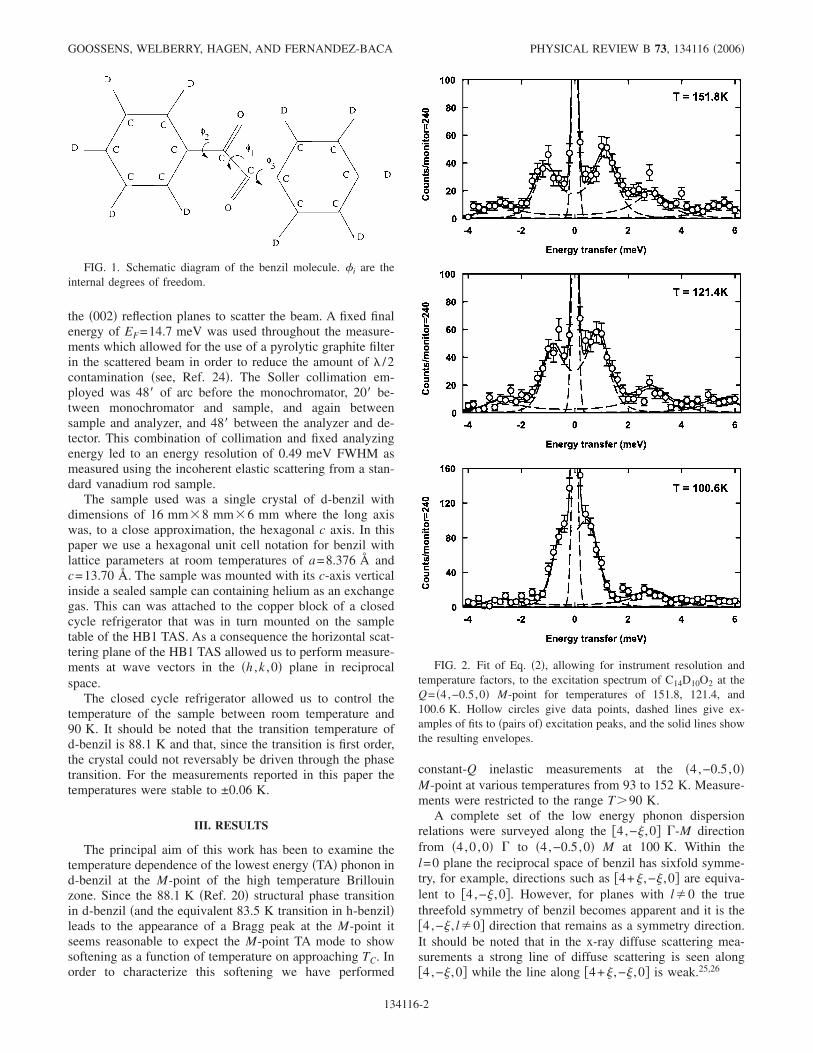
FIG. 2. Fit of Eq. �2�, allowing for instrument resolution andtemperature factors, to the excitation spectrum of C14D10O2 at theQ= �4,−0.5,0� M-point for temperatures of 151.8, 121.4, and100.6 K. Hollow circles give data points, dashed lines give ex-amples of fits to �pairs of� excitation peaks, and the solid lines showthe resulting envelopes.
GOOSSENS, WELBERRY, HAGEN, AND FERNANDEZ-BACA PHYSICAL REVIEW B 73, 134116 �2006�
134116-2
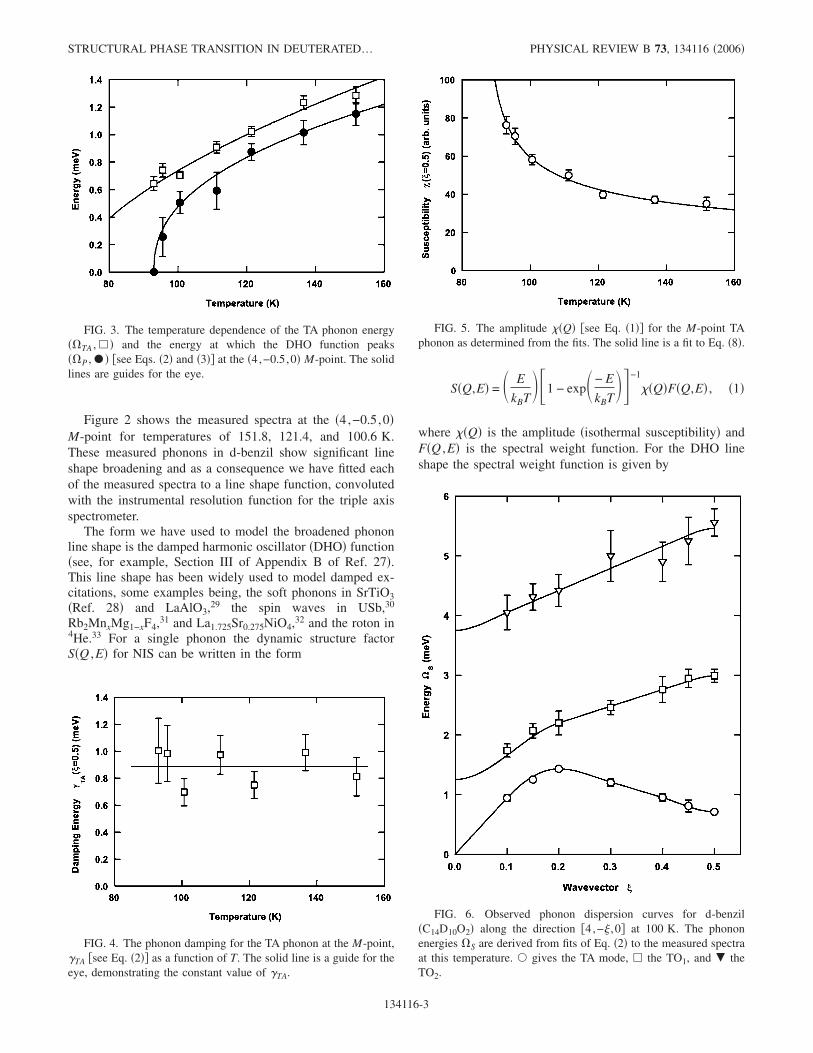
Figure 2 shows the measured spectra at the �4,−0.5,0�M-point for temperatures of 151.8, 121.4, and 100.6 K.These measured phonons in d-benzil show significant lineshape broadening and as a consequence we have fitted eachof the measured spectra to a line shape function, convolutedwith the instrumental resolution function for the triple axisspectrometer.
The form we have used to model the broadened phononline shape is the damped harmonic oscillator �DHO� function�see, for example, Section III of Appendix B of Ref. 27�.This line shape has been widely used to model damped ex-citations, some examples being, the soft phonons in SrTiO3�Ref. 28� and LaAlO3,29 the spin waves in USb,30
Rb2MnxMg1−xF4,31 and La1.725Sr0.275NiO4,32 and the roton in4He.33 For a single phonon the dynamic structure factorS�Q ,E� for NIS can be written in the form
S�Q,E� = � E
kBT��1 − exp�− E
kBT�−1
�Q�F�Q,E� , �1�
where �Q� is the amplitude �isothermal susceptibility� andF�Q ,E� is the spectral weight function. For the DHO lineshape the spectral weight function is given by
FIG. 3. The temperature dependence of the TA phonon energy�TA , � � and the energy at which the DHO function peaks�P , � � �see Eqs. �2� and �3�� at the �4,−0.5,0� M-point. The solidlines are guides for the eye.
FIG. 4. The phonon damping for the TA phonon at the M-point,�TA �see Eq. �2�� as a function of T. The solid line is a guide for theeye, demonstrating the constant value of �TA.
FIG. 5. The amplitude �Q� �see Eq. �1�� for the M-point TAphonon as determined from the fits. The solid line is a fit to Eq. �8�.
FIG. 6. Observed phonon dispersion curves for d-benzil�C14D10O2� along the direction �4,−� ,0� at 100 K. The phononenergies S are derived from fits of Eq. �2� to the measured spectraat this temperature. � gives the TA mode, � the TO1, and � theTO2.
STRUCTURAL PHASE TRANSITION IN DEUTERATED¼ PHYSICAL REVIEW B 73, 134116 �2006�
134116-3
F�Q,E� =1
�� �S�Q�S
2�Q��E2 − S
2�Q��2 + ��S�Q�E�2� , �2�
where S�Q� is the “pole” energy �phonon energy whenthe damping is small� and �S�Q� is the damping. In thelimit that �S�Q�→0 this line shape reduces to a sharp peak� �E−S�Q��� at the “phonon energy” S�Q�.
The instrumental resolution function used in the convolu-tion was determined using the RESTRAX program34 withthe appropriate instrumental parameters for the HB1 TASgiven in Sec. II and a sample mosaic spread of 0.4°. In Fig.2 the solid line is the envelope resulting from fitting threeDHO functions, convoluted with the resolution function, tothe inelastic spectrum—individual peak fits are noted withdashed lines. Also included is a Gaussian “elastic line” peakto account for � /2 contamination from the �8,−1,0� Braggpeak. Even though a pyrolytic graphite filter was used infront of the sample to analyzer collimator to reduce the � /2contamination a small residual amount remains apparent.
The three DHO functions used to model the phonon spec-trum account for the TA mode, which is at lowest energy, andthen two optic phonons, TO1 and TO2, at higher energy. Itshould be noted that the symmetric form of the DHO in Eq.�2� constrains equivalent phonon peaks on energy loss and
gains to have the same values for S�Q�, S�Q�, and �S�Q�.The difference in peak heights and widths between energyloss and gain is solely given by the thermal population factorin Eq. �2� and the resolution function. Furthermore the twooptic phonons TO1 and TO2 at the M-point show no measur-able temperature dependence. As a consequence we have de-termined the parameters TO1
, TO1, �TO1
, TO2, TO2
, and�TO2
at 151.8 K and held them fixed at all other tempera-tures. This means that the only variable parameters to fit thespectra at temperatures T�151.8 K are the three parametersTA ,TA, and �TA, describing the soft TA mode.
The temperature dependence of the values of S�Q� and�S�Q� for the TA phonon �TA�Q� and �TA�Q�, respectively�at the M-point are shown in Figs. 3 and 4, respectively. It isinteresting to note that �S�Q� for this M-point TA mode isessentially independent of temperature, the flat solid lineshown in Fig. 4 is the average value of the data points, indi-cating a constant �temperature independent� damping mecha-nism. In SrTiO3 �Ref. 28� and LaAlO3 �Ref. 29� it is alsoobserved that, for temperatures just above TC, the dampingconstant for the soft phonon is independent of temperature.
It should be noted that when �S�Q��0 the energy atwhich the DHO function peaks is not the phonon energyS�Q� but instead the peak energy P�Q� which is given by
P�Q� = S2�Q� − 1
2�S2�Q� . �3�
Also shown in Fig. 3 are the values for P�Q� calculatedfrom Eq. �3�. At 93 K �the lowest measurement temperaturein Fig. 3� the argument of the square root in Eq. �3� is nega-tive indicating that the phonon is overdamped �i.e., there isonly a single peak at zero energy�, and as a consequence wehave taken P�Q�=0 for this data point. Figure 5 shows thetemperature dependence of the amplitude �Q� �see Eq. �1��for the M-point phonon as determined from the fits.
To determine the phonon dispersion relations at 100 Kalong the �4,−� ,0� direction a series of constant-Q inelasticscans was performed for different values of �. These scanswere each fitted to a series of DHO functions in the same
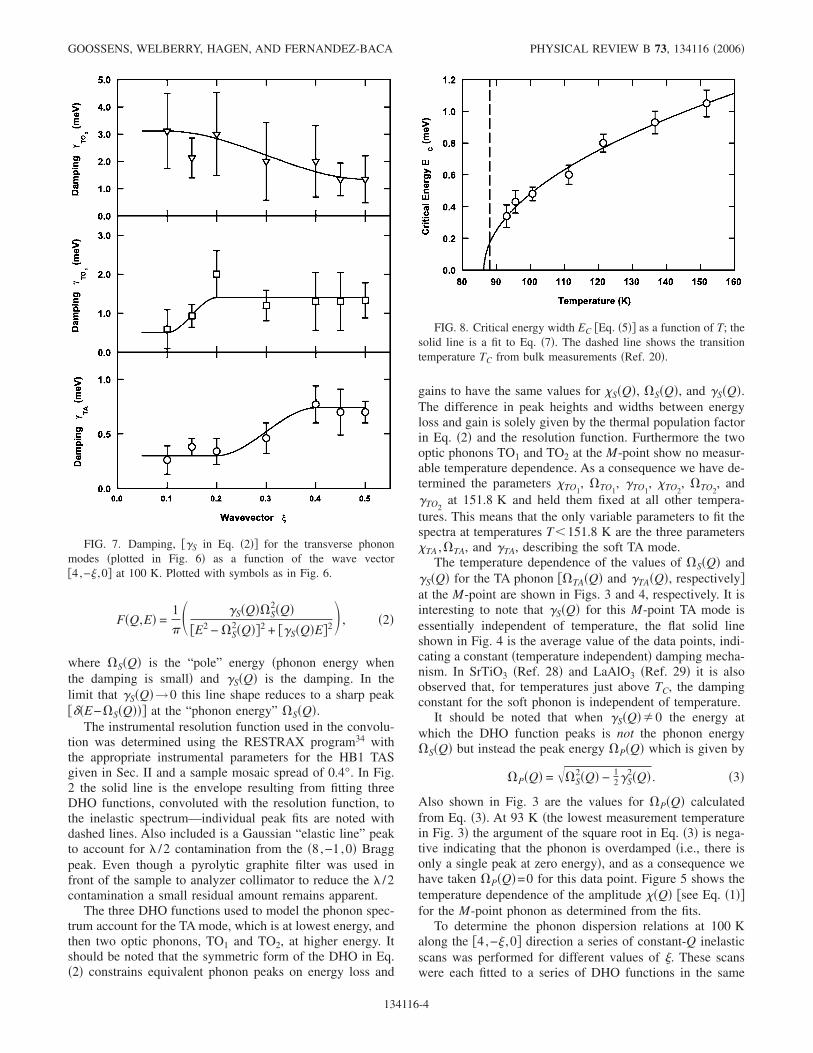
FIG. 7. Damping, ��S in Eq. �2�� for the transverse phononmodes �plotted in Fig. 6� as a function of the wave vector�4,−� ,0� at 100 K. Plotted with symbols as in Fig. 6.
FIG. 8. Critical energy width EC �Eq. �5�� as a function of T; thesolid line is a fit to Eq. �7�. The dashed line shows the transitiontemperature TC from bulk measurements �Ref. 20�.
GOOSSENS, WELBERRY, HAGEN, AND FERNANDEZ-BACA PHYSICAL REVIEW B 73, 134116 �2006�
134116-4
way that the scans at the �4,−0.5,0� M-point were fitted. InFig. 6 the phonon dispersion relations determined at 100 Kalong the �4,−� ,0� direction are shown by the open symbols.
The dispersion relations in Fig. 6 were defined by plottingthe results for S�Q� and the corresponding results for �S�Q�at 100 K are plotted in Fig. 7. It is, however, the case that forthe values of S�Q� and �S�Q� plotted in Figs. 6 and 7,respectively, there is not a substantial difference betweenS�Q� and P�Q� except for the TA mode at the M-point�4,−0.5,0�.
IV. DISCUSSION
The results summarized in Figs. 2 and 3 clearly indicatethat the M-point TA phonon is softening with decreasingtemperature as TC is approached. However, from the per-spective of the theory of critical phenomena neither TA�Q�nor P�Q�, nor for that matter �TA�Q�, is a good measure ofthe “critical narrowing” of the characteristic �critical� energywidth EC on approaching the structural phase transition. Avery useful definition of the characteristic energy width ECfor the critical scattering is given in Chap. 7 of Ref. 35through the spectral weight function F�Q ,E�. The spectralweight function is, in its definition, required to obey the nor-malization condition
�−�
�
F�Q,E�dE = 1 �4�
and the characteristic �critical� energy, EC, is then defined35
by the relation
�−EC
EC
F�Q,E�dE = 12 . �5�
The F�Q ,E� for the DHO given in Eq. �2� satisfies the nor-malization condition given in Eq. �4�. Hence, we have deter-mined values for the characteristic energy EC at each tem-perature by using the values of TA�Q� and �TA�Q� from thefits at each temperature and numerically integrating the left-hand side of Eq. �5�, where F�Q ,E� is the spectral weightfunction for the TA mode, until we reach a limit that satisfiesEq. �5�. These values for EC are plotted as a function oftemperature in Fig. 8. The error bars given for EC in Fig. 8were found using the standard relation
EC =� �EC
�TA TA�2
+ � �EC
��TA �TA�2
�6�
and the appropriate numerical evaluation of the derivatives.As might be expected the values of EC plotted in Fig. 8
decrease �i.e., show a narrowing� with decreasing tempera-ture. We have fitted the values of EC to a power law tem-perature dependence given by
EC�T� = E0tx = E0�T − TC*
TC* �x
, �7�
where x is the critical exponent and TC* is the “critical”
temperature. In these fits the critical exponent is fixed atthe classical �mean field� value x=0.5. It is worth notingthat in the case of strontium titanate �SrTiO3�, the prototypi-cal example of a displacive structural phase transition,the R-point soft phonon follows such a form �EC
2 �T−TC�over a wide range of reduced temperature above TC.36–38
The solid line in Fig. 8 is a best fit result with x=0.5fixed and corresponds to the values TC
* = �86.3±2.3� K andE0= �1.21±0.08� meV.
The power law form of Eq. �7� is a characteristic formfor second order �continuous� phase transitions while itis known from bulk measurements that the phase transitionin d-benzil and h-benzil is weakly first order.20 It is, there-fore, not surprising that the critical temperatureTC
* = �86.3±2.3� K is lower than the true phase transitiontemperature for d-benzil of 88.1 K.20 This behavior isobserved at other first order phase transitions, for example,the antiferromagnetic phase transition in UO2. Neutronscattering measurements of both the inverse correlationlength ��� �Ref. 39� and the critical energy width �EC� �Ref.40� for UO2 show a power law behavior that extrapolates toa TC
* �25 K some 7 K below the true �first order� transitiontemperature of 31.7 K.40
A similar behavior can also be seen in the temperaturedependence of the amplitude �susceptibility� �Q� which wasplotted in Fig. 5. Again we can fit this to the characteristicsecond order form
�Q,T� = 0�Q�t−� = 0�Q��T − TC*
TC* �−�
. �8�
However in this case a good fit cannot be obtained by fixing� at its classical �mean field� value of 1.0, and instead
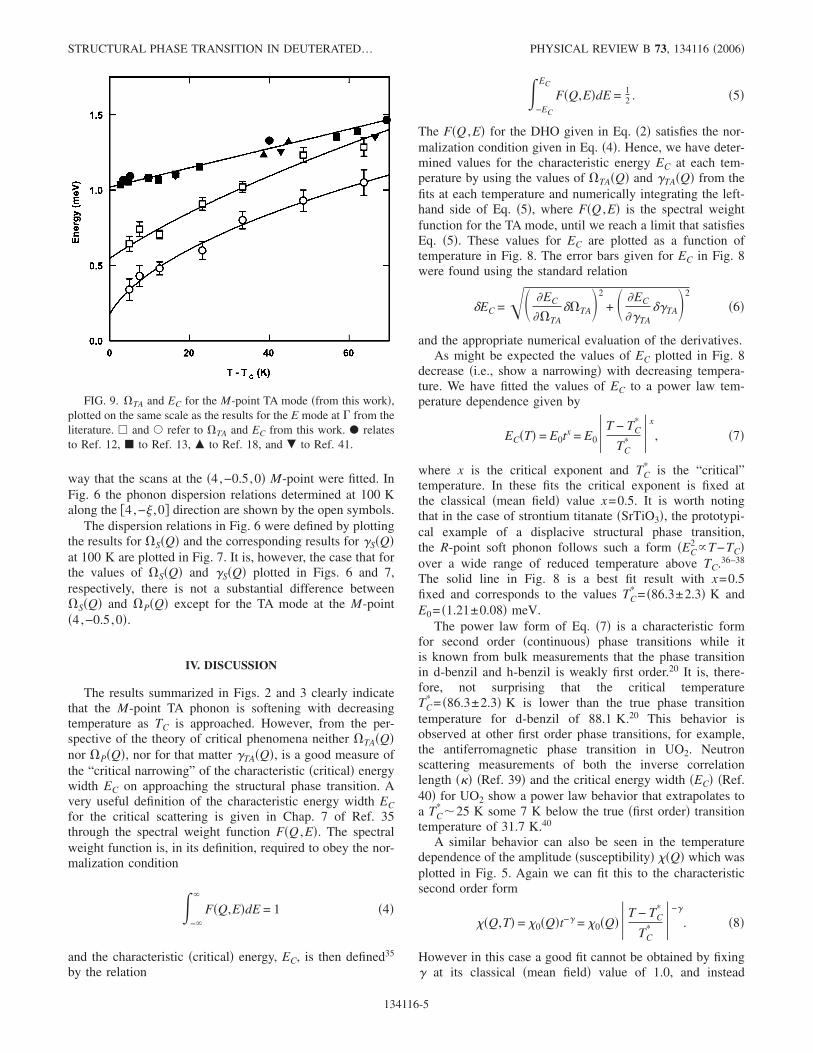
FIG. 9. TA and EC for the M-point TA mode �from this work�,plotted on the same scale as the results for the E mode at � from theliterature. � and � refer to TA and EC from this work. � relatesto Ref. 12, � to Ref. 13, � to Ref. 18, and � to Ref. 41.
STRUCTURAL PHASE TRANSITION IN DEUTERATED¼ PHYSICAL REVIEW B 73, 134116 �2006�
134116-5
we must let all three parameters vary. The best fit result,which is shown by the solid line in Fig. 5, has the values�=0.37±0.10, TC
* = �86.2±4.5� K, and 0�Q�=30.0±1.5. Thevalue for TC
* = �86.2±4.5� K is very close to the value ob-tained from the fit to EC�T� of TC
* = �86.3±2.3� K.A comparison of the M-point mode we have observed
with the �-point mode observed in previous studies is shownin Fig. 9. This figure shows, by the solid data points, theenergies reported in the literature12,13,18,41 for the �-pointTO1 mode �which is also known as the E mode in the Ramanscattering papers� as a function of the temperature above thetransition temperature, i.e., T−TC. On the same scale wehave plotted the phonon energy TA �open circles� and criti-cal energy EC �open squares� for the M-point TA mode. Fig-ure 9 shows that at all temperatures the TA mode at theM-point is of lower energy than the TO1 �a.k.a the E mode�at the �-point and that as TC is approached from above theTA mode softens more rapidly, both in proportional and ab-solute terms. This strongly suggests that, contrary to the ear-lier suggestion,22 the softening of the �-point mode is un-likely to be the primary mechanism driving the zone-boundary softening that leads to the cell doubling at thephase transition. It is possible that the order parameter cou-pling posited in �Ref. 22� does contribute to the transition butit does not trigger an instability at the M-point; rather, theinstability is intrinsically present.
V. CONCLUSIONS
The suggestion that the 88.1 K phase transition in deuter-ated benzil �83.5 K in benzil� occurs because of the soften-ing of a �-point transverse optic phonon that triggers aninstability at the M-point22 has been tested by neutron inelas-tic scattering. An examination of the temperature dependenceof the transverse acoustic phonon at the M-point shows thatit has an energy that is always lower than that of the �-pointoptic mode and that it softens more rapidly than the �-pointmode as the transition temperature is approached. The be-havior of the M-point phonon is consistent with that of aconventional soft mode; such transitions are not the normin organic molecular systems, but neither are theyunprecedented.42,43 As a consequence we conclude that thereis no evidence that the phase transition is driven, or trig-gered, by the �-point optic phonon.
ACKNOWLEDGMENTS
D.J.G. and T.R.W. thank A.P. Heerdegen for technicalsupport and the Australian Research Council and Access toMajor Research Facilities Program for financial support. OakRidge National Laboratory is managed by UT-Battelle, LLCfor the U.S. Department of Energy under Contract No. DE-AC05-00OR22725.
*Electronic address: [email protected] M. More, G. Odou, and J. Lefebvre, Acta Crystallogr., Sect. B:
Struct. Sci. 43, 398 �1987�.2 T. M. Kolev and B. A. Stamboliyska, Spectrochim. Acta, Part A
58, 3127 �2002�.3 S. A. Solin and A. K. Ramdas, Phys. Rev. 174, 1069 �1968�.4 F. Stenman, J. Chem. Phys. 51, 3141 �1969�.5 H. Claus, H. H. Hacker, H. W. Schrötter, J. Brandmüller, and D.
Hassühl, Phys. Rev. 187, 1128 �1969�.6 H. Claus, H. W. Schrötter, and J. Brandmüller, J. Chem. Phys.
52, 6448 �1970�.7 J. Jerphagon, IEEE J. Quantum Electron. QE-7, 42 �1971�.8 R. Vacher, M. Boissier, and J. Sapriel, Phys. Rev. B 23, 215
�1981�.9 P. H. Esherick and B. E. Kohler, J. Chem. Phys. 59, 6681 �1973�.
10 P. Figuiére and H. Szwarc, Mol. Cryst. Liq. Cryst. 32, 27 �1976�.11 P. Figuiére and H. Szwarc, Mol. Cryst. Liq. Cryst. 35, 1 �1976�.12 D. R. Moore, V. J. Tekippe, A. K. Ramdas, and J. C. Tolédano,
Phys. Rev. B 27, 7676 �1983�.13 J. Sapriel, A. Boudou, and A. Perigaud, Phys. Rev. B 19, 1484
�1979�.14 L. Colombo, D. Kirin, V. Volovsek, N. E. Lindsay, J. F. Sullivan,
and J. R. Durig, J. Phys. Chem. 93, 6290 �1989�.15 A. Yoshihara, E. R. Bernstein, and J. C. Raich, J. Chem. Phys.
79, 2504 �1983�.16 A. L. Roy, O. Et-Tabti, and R. Guérin, J. Mol. Struct. 294, 147
�1993�.17 A. Dworkin and A. H. Fuchs, J. Chem. Phys. 67, 1789 �1977�.18 J. Petzelt, Y. G. Goncharov, G. V. Kozlov, A. A. Volkov, B.
Wyncke, and F. Brehat, Czech. J. Phys., Sect. B 34, 887 �1984�.19 D. Havlik, W. Schranz, H. Warhanek, P. Zielinski, M. More, and
G. Odou, Ferroelectrics 190, 95 �1997�.20 D. J. Goossens, X. Wu, and M. Prior, Solid State Commun. 136,
543 �2005�.21 R. O. Piltz and W. T. Klooster �private communication� �2004�.22 J. C. Tolédano, Phys. Rev. B 20, 1147 �1979�.23 H. Terauchi, T. Kojima, K. Sakaue, F. Tajiri, and H. Maeda, J.
Chem. Phys. 76, 612 �1982�.24 S. M. Shapiro and N. J. Chesser, Nucl. Instrum. Methods 101,
183 �1972�.25 T. R. Welberry, D. J. Goossens, A. J. Edwards, and W. I. F. David,
Acta Crystallogr., Sect. A: Found. Crystallogr. A57, 101 �2001�.26 T. R. Welberry, D. J. Goossens, W. I. F. David, M. J. Gutmann,
M. J. Bull, and A. P. Heerdegen, J. Appl. Crystallogr. 36, 1440�2003�.
27 S. W. Lovesey, Theory of Neutron Scattering from CondensedMatter �OUP, UK, 1984�, Vol. 1.
28 S. M. Shapiro, J. D. Axe, G. Shirane, and T. Riste, Phys. Rev. B6, 4332 �1972�.
29 J. K. Kjems, G. Shirane, K. A. Muller, and H. J. Scheel, Phys.Rev. B 8, 1119 �1973�.
30 M. Hagen, W. G. Stirling, and G. H. Lander, Phys. Rev. B 37,1846 �1988�.
31 S. I. Itoh, H. Ikeda, H. Yoshizawa, M. J. Harris, and U. Steigen-berger, J. Phys. Soc. Jpn. 67, 3610 �1998�.
32 S. H. Lee, J. M. Tranquada, K. Yamada, D. J. Buttrey, Q. Li, andS. W. Cheong, Phys. Rev. Lett. 88, 126401 �2002�.
33 C. R. Anderson, K. H. Andersen, J. Bossy, W. G. Stirling, R. M.
GOOSSENS, WELBERRY, HAGEN, AND FERNANDEZ-BACA PHYSICAL REVIEW B 73, 134116 �2006�
134116-6
Dimeo, P. E. Sokol, J. C. Cook, and D. W. Brown, Phys. Rev. B59, 13588 �1999�.
34 J. Saroun and J. Kulda, Physica B 234, 1102 �1997�.35 M. F. Collins, Magnetic Critical Scattering �OUP, USA, 1989�.36 R. A. Cowley, W. J. L. Buyers, and G. Dolling, Solid State Com-
mun. 7, 181 �1969�.37 G. Shirane and Y. Yamada, Phys. Rev. 177, 858 �1969�.38 K. Otnes, T. Riste, G. Shirane, and J. Feder, Solid State Commun.
9, 1103 �1971�.39 W. J. L. Buyers and T. M. Holden, Handbook of the Physics and
Chemistry of the Actinides �North-Holland, Amsterdam, 1985�,Vol. 2, p. 239.
40 R. Caciuffo, G. Amoretti, P. Santini, G. H. Lander, J. Kulda, andP. de V. Du Plessis, Phys. Rev. B 59, 13892 �1999�.
41 M. A. Ivanov, V. A. Kimasov, and Y. F. Markov, Phys. SolidState 44, 373 �2002�.
42 W. D. Ellenson and J. K. Kjems, J. Chem. Phys. 67, 3619 �1977�.43 H. Cailleau, A. Girard, F. Moussa, and C. M. E. Zeyen, Solid
State Commun. 29, 259 �1979�.
STRUCTURAL PHASE TRANSITION IN DEUTERATED¼ PHYSICAL REVIEW B 73, 134116 �2006�
134116-7