a jit compiler...jit
TRANSCRIPT

A JIT Compilerfor Android’s Dalvik VMBen Cheng, Bill BuzbeeMay 2010
Overview
• View live session notes and ask questions on Google Wave:– http://bit.ly/bIzjnF
• Dalvik Environment• Trace vs. Method Granularity JITs• Dalvik JIT 1.0• Future directions for the JIT• Performance Case Studies• Profiling JIT’d code• Built-in Self-Verification Mode
3
Dalvik Execution Environment
• Virtual Machine for Android Apps– See 2008 Google IO talk
• http://www.youtube.com/watch?v=ptjedOZEXPM
• Very compact representation• Emphasis on code/data sharing to reduce memory usage• Process container sandboxes for security
4
Dalvik Interpreter
• Dalvik programs consist of byte code, processed by a host-specific interpreter– Highly-tuned, very fast interpreter (2x similar)– Typically less than 1/3rd of time spent in the interpreter– OS and performance-critical library code natively compiled– Good enough for most applications
• Performance a problem for compute-intensive applications– Partial solution was the release of the Android Native
Development Kit, which allows Dalvik applications to call out to statically-compiled methods
• Other part of the solution is a Just-In-Time Compiler– Translates byte code to optimized native code at run time
5
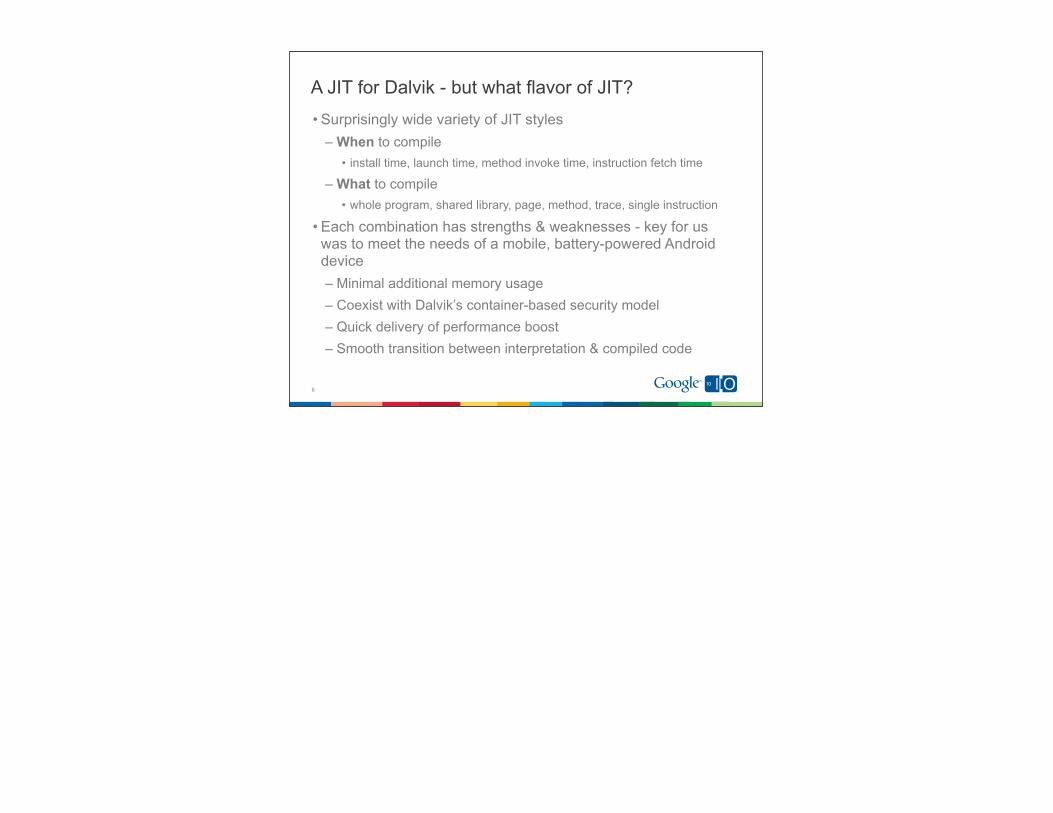
A JIT for Dalvik - but what flavor of JIT?
• Surprisingly wide variety of JIT styles– When to compile
• install time, launch time, method invoke time, instruction fetch time
– What to compile• whole program, shared library, page, method, trace, single instruction
• Each combination has strengths & weaknesses - key for us was to meet the needs of a mobile, battery-powered Android device– Minimal additional memory usage– Coexist with Dalvik’s container-based security model– Quick delivery of performance boost– Smooth transition between interpretation & compiled code
6
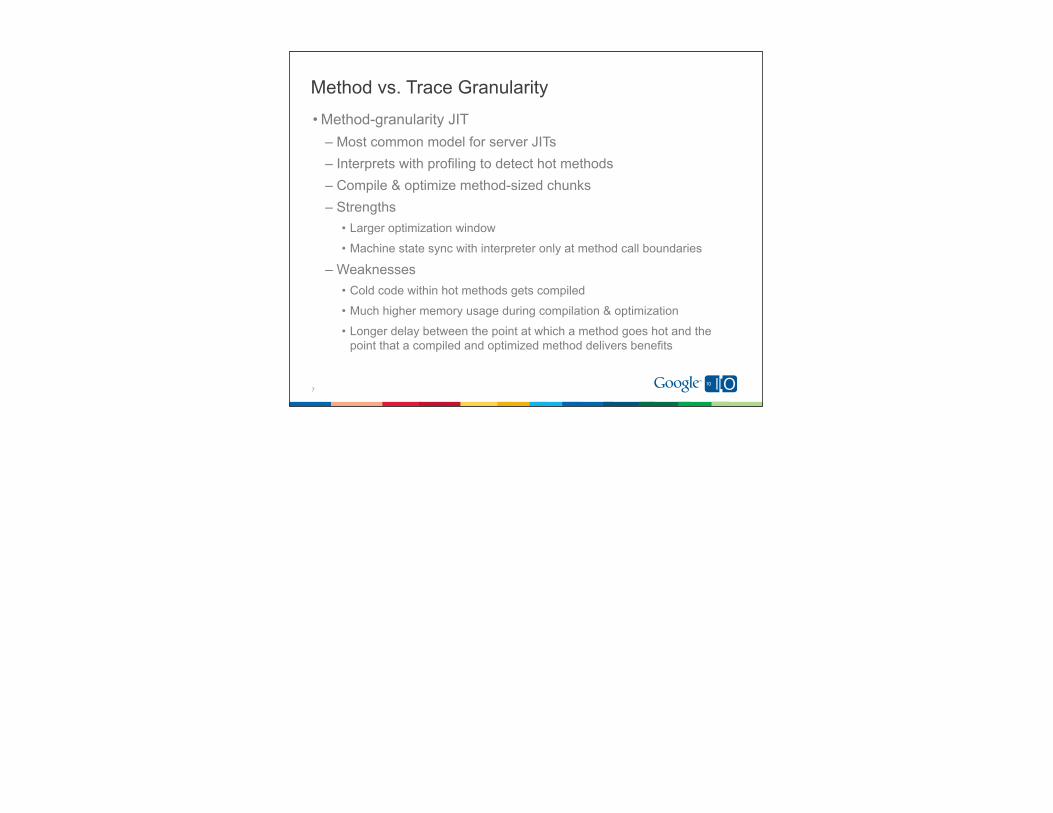
Method vs. Trace Granularity
• Method-granularity JIT– Most common model for server JITs– Interprets with profiling to detect hot methods– Compile & optimize method-sized chunks– Strengths
• Larger optimization window
• Machine state sync with interpreter only at method call boundaries
– Weaknesses• Cold code within hot methods gets compiled
• Much higher memory usage during compilation & optimization
• Longer delay between the point at which a method goes hot and the point that a compiled and optimized method delivers benefits
7
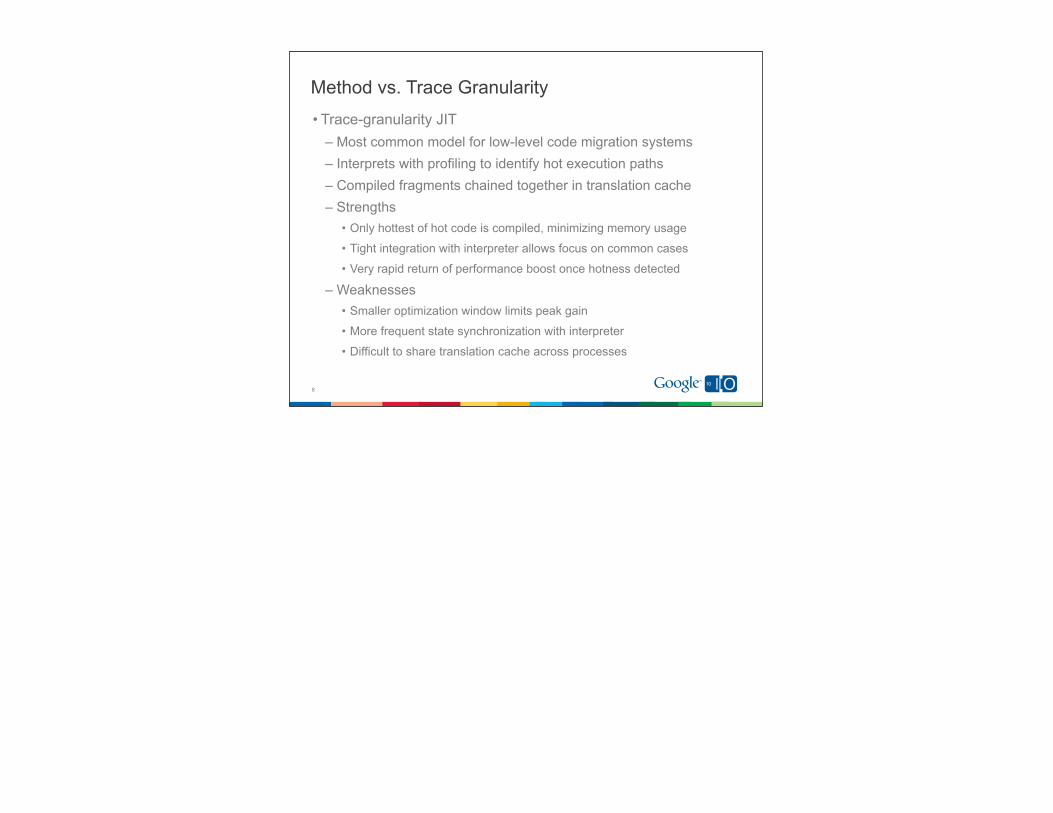
Method vs. Trace Granularity
• Trace-granularity JIT– Most common model for low-level code migration systems– Interprets with profiling to identify hot execution paths– Compiled fragments chained together in translation cache– Strengths
• Only hottest of hot code is compiled, minimizing memory usage
• Tight integration with interpreter allows focus on common cases
• Very rapid return of performance boost once hotness detected
– Weaknesses• Smaller optimization window limits peak gain
• More frequent state synchronization with interpreter
• Difficult to share translation cache across processes
8
9
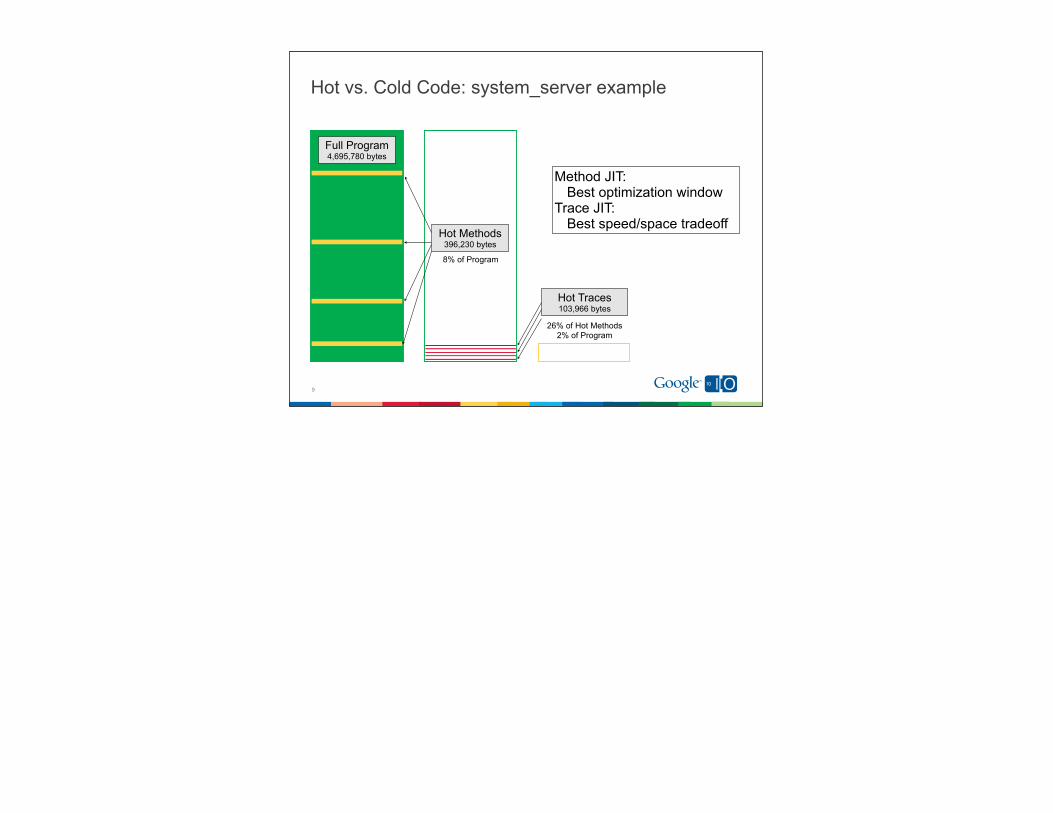
Full Program4,695,780 bytes
Hot Methods396,230 bytes
Hot Traces103,966 bytes
8% of Program
26% of Hot Methods2% of Program
Hot vs. Cold Code: system_server example
Method JIT:Best optimization window
Trace JIT:Best speed/space tradeoff
The Decision: Start with a Trace JIT
• Minimizing memory usage critical for mobile devices• Important to deliver performance boost quickly
– User might give up on new app if we wait too long to JIT• Leave open the possibility of supplementing with method-based JIT– The two styles can co-exist– A mobile device looks more like a server when it’s plugged in– Best of both worlds
• Trace JIT when running on battery
• Method JIT in background while charging
10
11
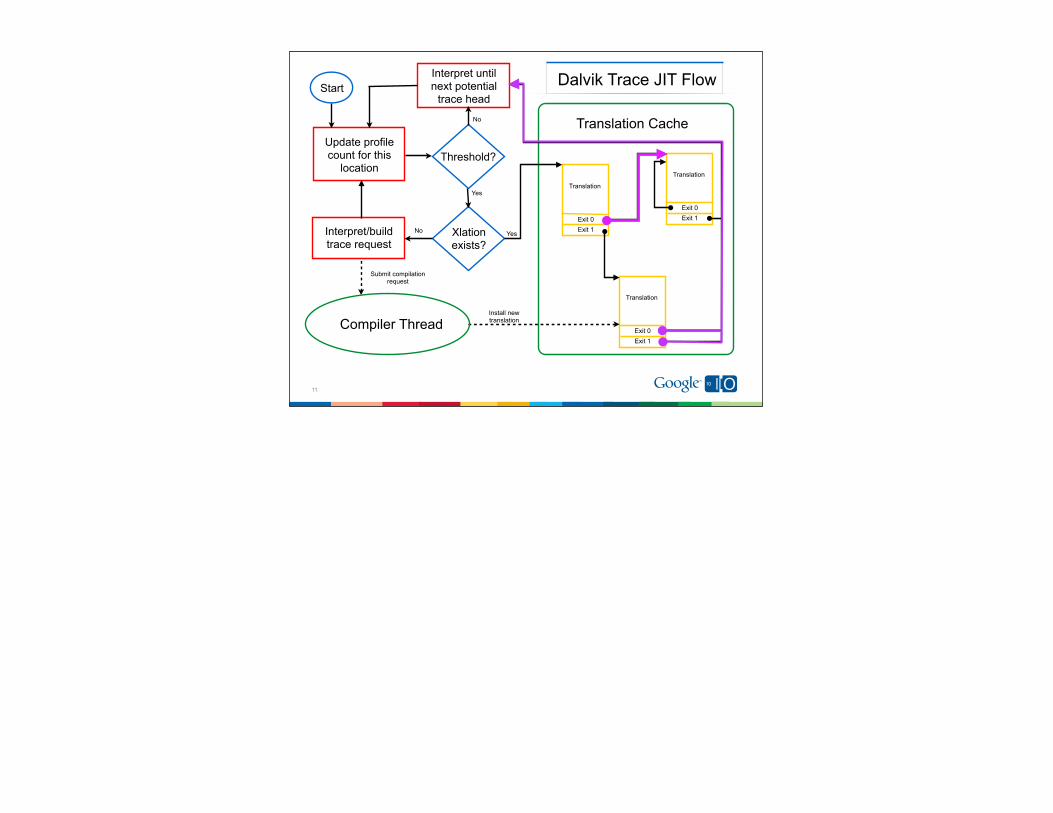
Start
Update profile count for this
locationThreshold?
Xlation exists?
Interpret until next potential
trace head
Interpret/build trace request
No
Yes
Exit 0Exit 1
Translation
Exit 0Exit 1
Translation
Exit 0Exit 1
Translation
No
Submit compilation request
Install new translation
Translation Cache
Compiler Thread
Yes
Dalvik Trace JIT Flow
Dalvik JIT v1.0 Overview
• Tight integration with interpreter– Useful to think of the JIT as an extension of the interpreter
• Interpreter profiles and triggers trace selection mode when a potential trace head goes hot
• Trace request is built during interpretation– Allows access to actual run-time values– Ensures that trace only includes byte codes that have
successfully executed at least once (useful for some optimizations)
• Trace requests handed off to compiler thread, which compiles and optimizes into native code
• Compiled traces chained together in translation cache
12
Dalvik JIT v1.0 Features
• Per-process translation caches (sharing only within security sandboxes)
• Simple traces - generally 1 to 2 basic blocks long• Local optimizations
– Register promotion– Load/store elimination– Redundant null-check elimination– Heuristic scheduling
• Loop optimizations– Simple loop detection– Invariant code motion– Induction variable optimization
13
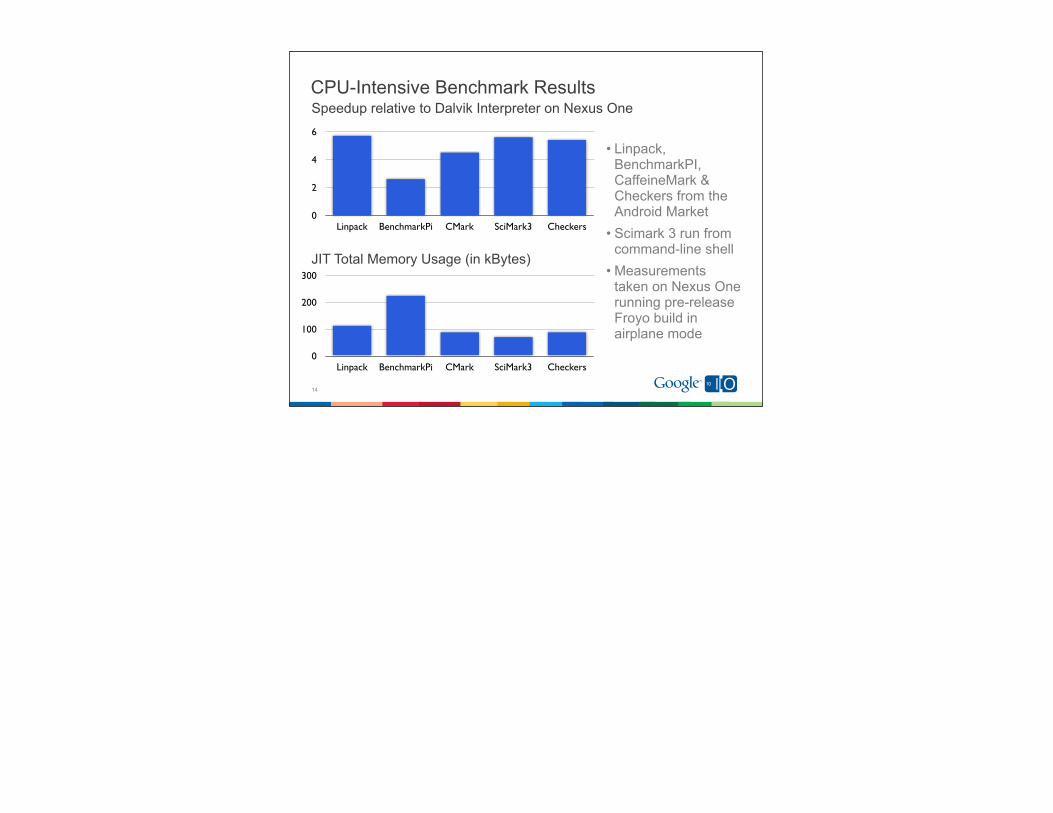
Speedup relative to Dalvik Interpreter on Nexus OneCPU-Intensive Benchmark Results
• Linpack, BenchmarkPI, CaffeineMark & Checkers from the Android Market
• Scimark 3 run from command-line shell
• Measurements taken on Nexus One running pre-release Froyo build in airplane mode
14
0
2
4
6
Linpack BenchmarkPi CMark SciMark3 Checkers
JIT Total Memory Usage (in kBytes)
0
100
200
300
Linpack BenchmarkPi CMark SciMark3 Checkers
Future Directions
• Method in-lining• Trace extension• Persistent profile information• Off-line trace coalescing• Off-line method translation• Tuning, tuning and more tuning
15
Google Confidential
Solving Performance and Correctness Issues
• How much boost will an app get from the JIT?– JIT can only remove cycles from the interpreter– OProfile can provide the insight to breakdown the workload
• How resource-friendly/optimizing is the JIT?– Again, OProfile can provide some high-level information– Use a special Dalvik build to analyze code quality
• How to debug the JIT?– Code generation vs optimization bugs– Self-verification against the interpreter
16
Google Confidential
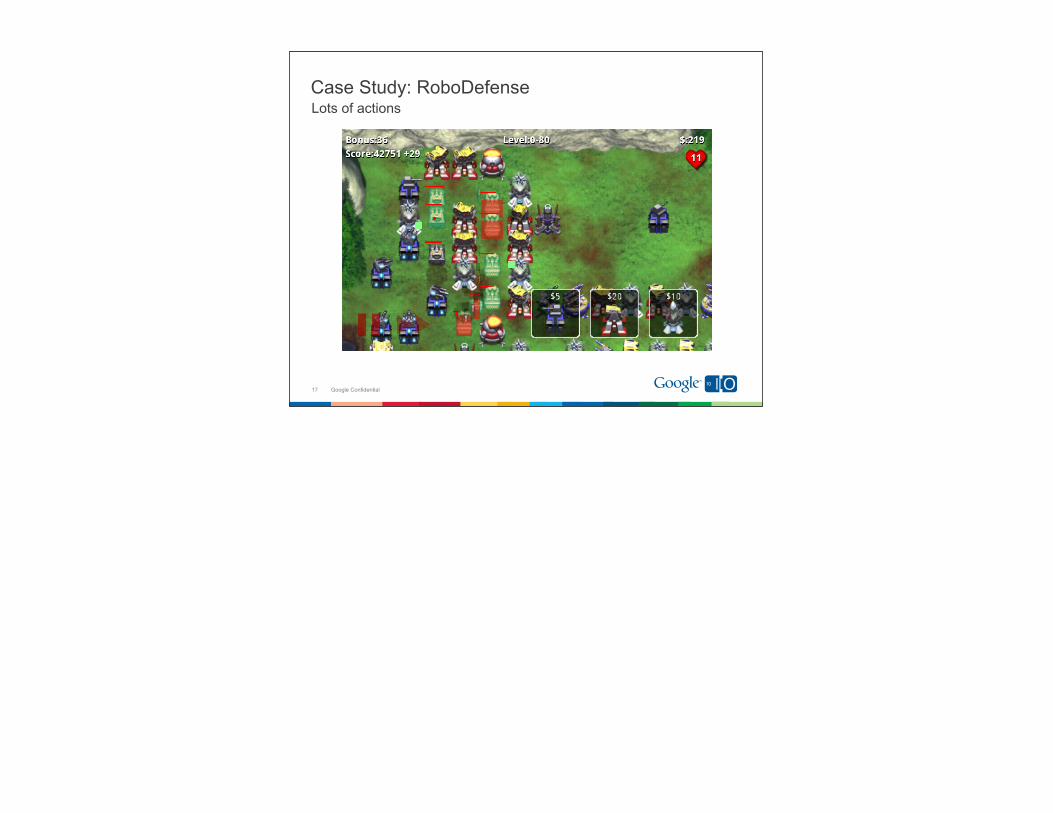
Case Study: RoboDefense
17
Lots of actions
Google Confidential
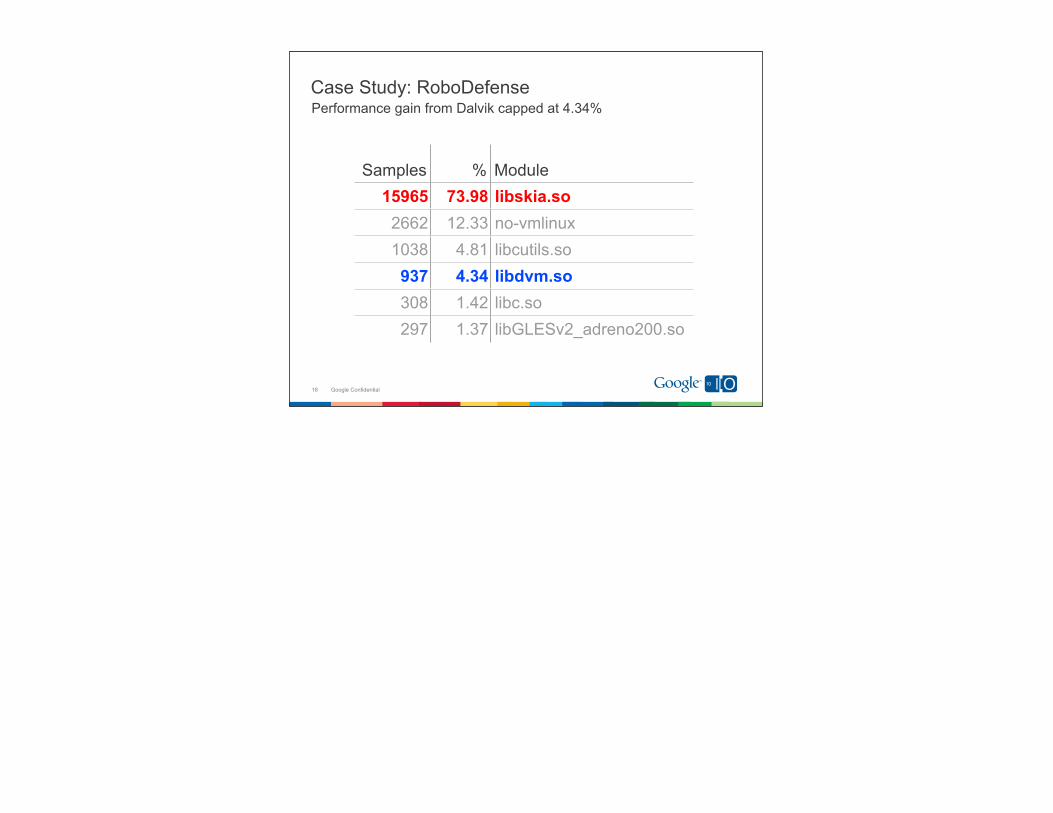
Case Study: RoboDefense
18
Performance gain from Dalvik capped at 4.34%
Samples % Module15965 73.98 libskia.so
2662 12.33 no-vmlinux1038 4.81 libcutils.so
937 4.34 libdvm.so308 1.42 libc.so297 1.37 libGLESv2_adreno200.so
Google Confidential
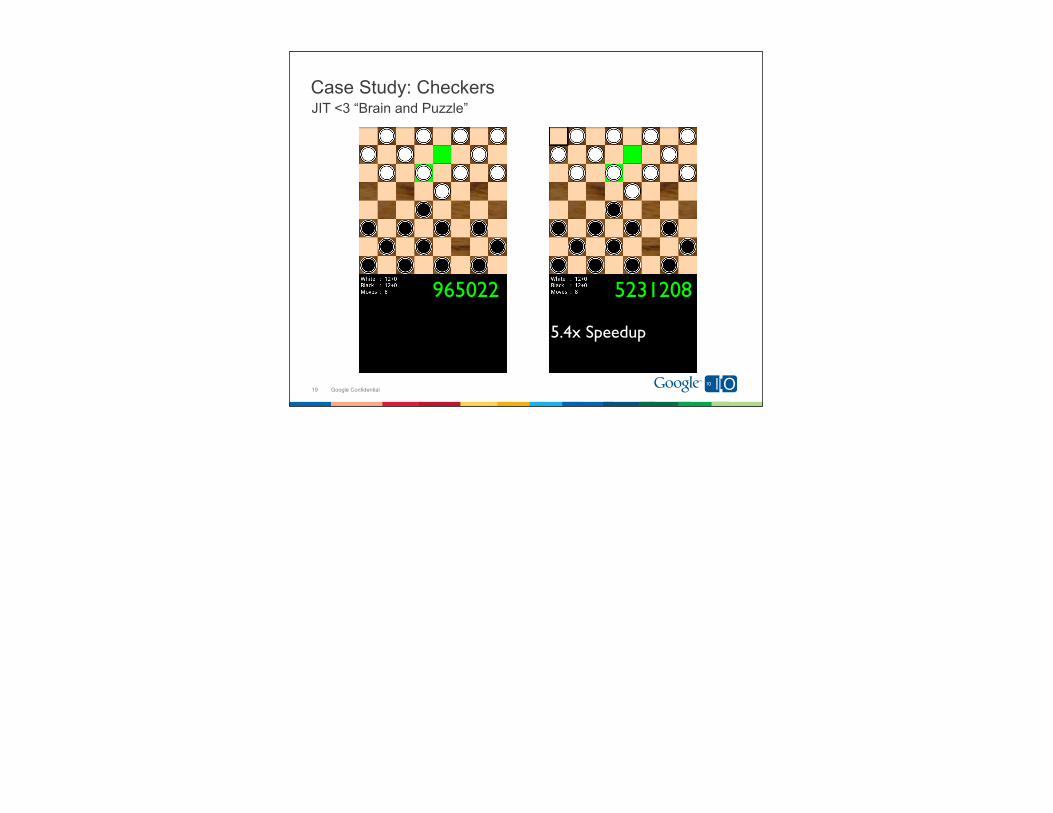
JIT <3 “Brain and Puzzle”Case Study: Checkers
19
5.4x Speedup
965022 5231208

Google Confidential
Use OProfile to explain the speedupCase Study: Checkers
20
Samples % Module
975 93.57 dalvik-jit-code-cache
30 2.88 libdvm.so
28 2.69 no-vmlinux
4 0.38 libc.so
3 0.09 libGLESv2_adreno200.so
96.45%3%
97%
Google Confidential
Part 2/3Solving Performance and Correctness Issues
• How much boost will an app get from the JIT?• How resource-friendly/optimizing is the JIT?• How to debug the JIT?
21
Google Confidential
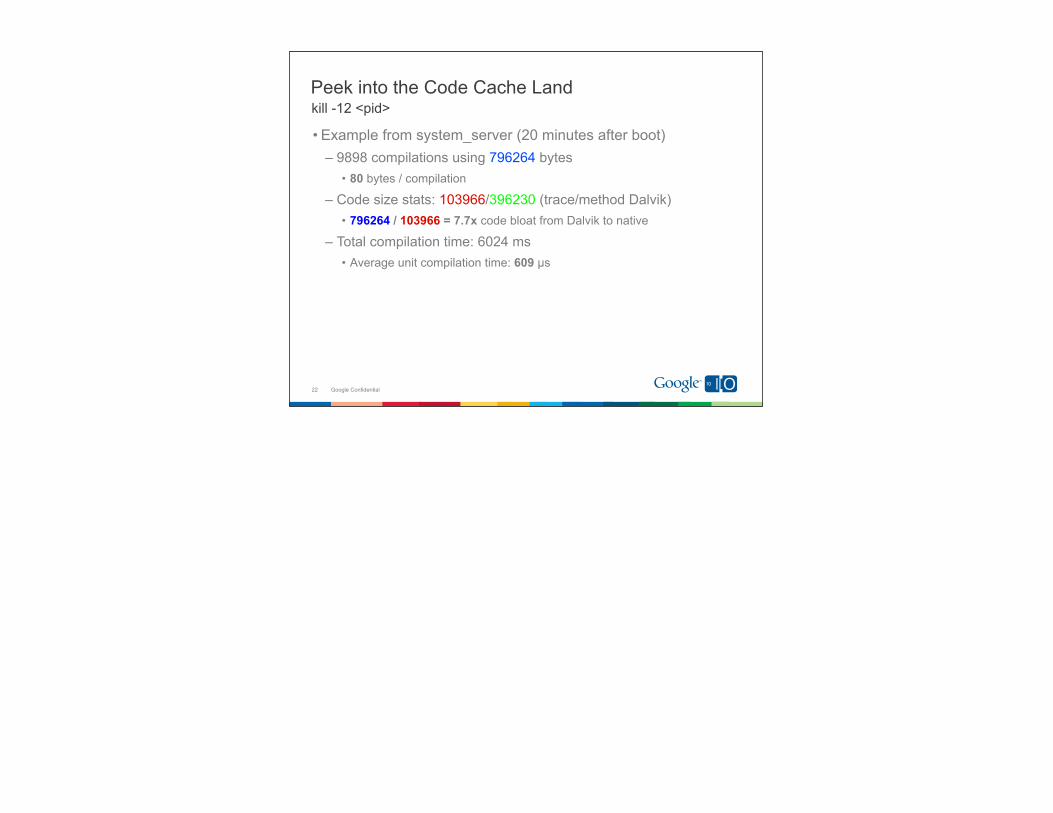
kill -12 <pid>Peek into the Code Cache Land
• Example from system_server (20 minutes after boot)– 9898 compilations using 796264 bytes
• 80 bytes / compilation
– Code size stats: 103966/396230 (trace/method Dalvik)• 796264 / 103966 = 7.7x code bloat from Dalvik to native
– Total compilation time: 6024 ms• Average unit compilation time: 609 µs
22
Google Confidential
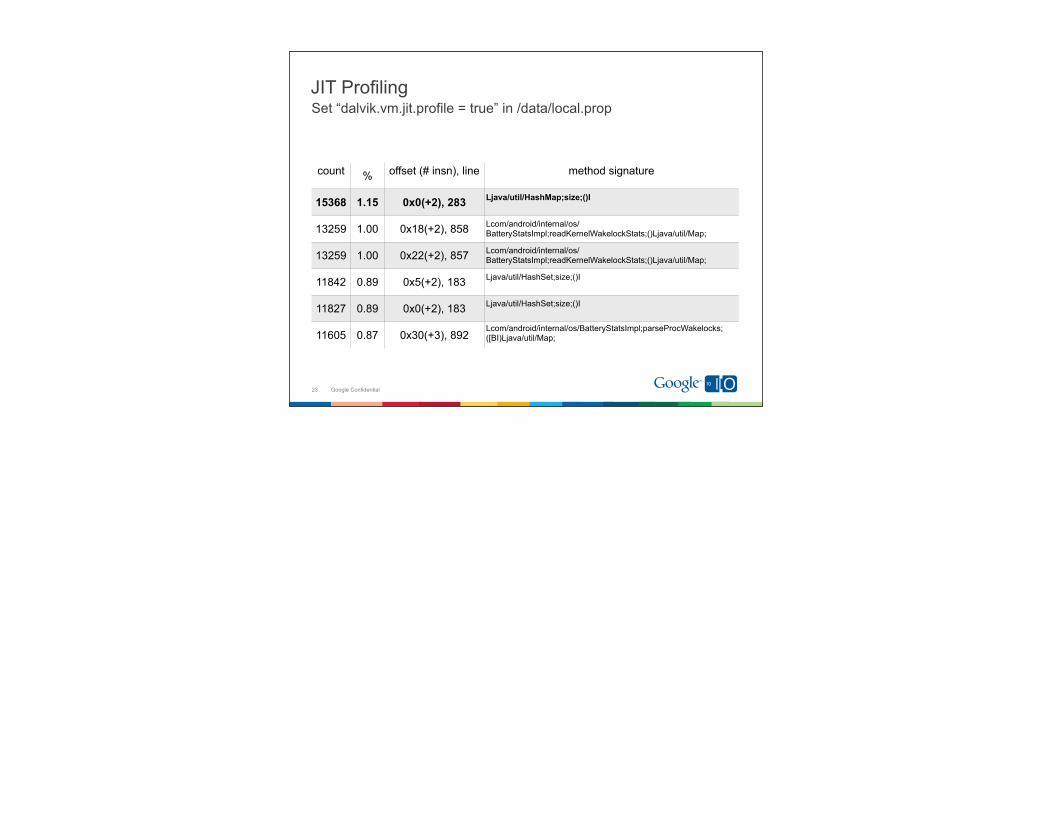
Set “dalvik.vm.jit.profile = true” in /data/local.propJIT Profiling
23
count % offset (# insn), line method signature
15368 1.15 0x0(+2), 283 Ljava/util/HashMap;size;()I
13259 1.00 0x18(+2), 858 Lcom/android/internal/os/BatteryStatsImpl;readKernelWakelockStats;()Ljava/util/Map;
13259 1.00 0x22(+2), 857 Lcom/android/internal/os/BatteryStatsImpl;readKernelWakelockStats;()Ljava/util/Map;
11842 0.89 0x5(+2), 183 Ljava/util/HashSet;size;()I
11827 0.89 0x0(+2), 183 Ljava/util/HashSet;size;()I
11605 0.87 0x30(+3), 892Lcom/android/internal/os/BatteryStatsImpl;parseProcWakelocks;([BI)Ljava/util/Map;
Google Confidential
Part 3/3Solving Performance and Correctness Issues
• How much boost will an app get from the JIT?• How resource-friendly/optimizing is the JIT?• How to debug the JIT?
24
Google Confidential
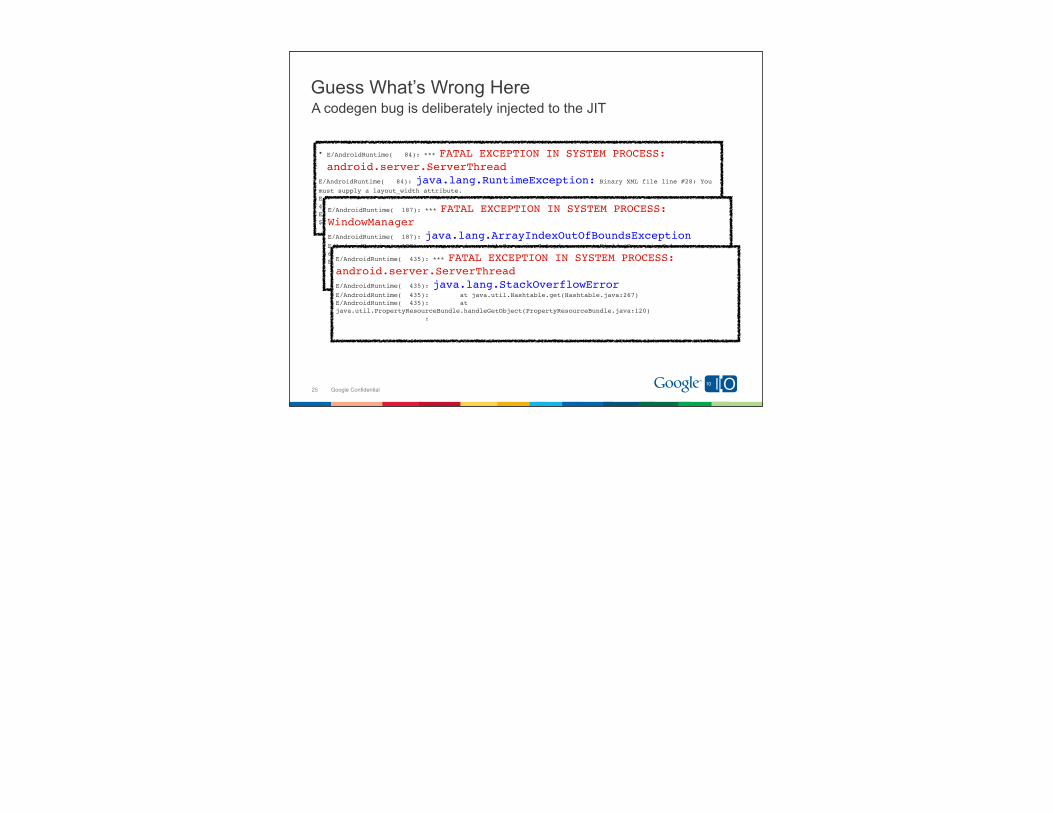
A codegen bug is deliberately injected to the JITGuess What’s Wrong Here
• E/AndroidRuntime( 84): *** FATAL EXCEPTION IN SYSTEM PROCESS:
android.server.ServerThreadE/AndroidRuntime( 84): java.lang.RuntimeException: Binary XML file line #28: You must supply a layout_width attribute.E/AndroidRuntime( 84): at android.content.res.TypedArray.getLayoutDimension(TypedArray.java:491)E/AndroidRuntime( 84): at android.view.ViewGroup$LayoutParams.setBaseAttributes(ViewGroup.java:3592)
25
E/AndroidRuntime( 187): *** FATAL EXCEPTION IN SYSTEM PROCESS: WindowManagerE/AndroidRuntime( 187): java.lang.ArrayIndexOutOfBoundsExceptionE/AndroidRuntime( 187): at java.util.GregorianCalendar.computeFields(GregorianCalendar.java:661)E/AndroidRuntime( 187): at java.util.Calendar.complete(Calendar.java:807) :
E/AndroidRuntime( 435): *** FATAL EXCEPTION IN SYSTEM PROCESS: android.server.ServerThreadE/AndroidRuntime( 435): java.lang.StackOverflowErrorE/AndroidRuntime( 435): at java.util.Hashtable.get(Hashtable.java:267)E/AndroidRuntime( 435): at java.util.PropertyResourceBundle.handleGetObject(PropertyResourceBundle.java:120) :
Google Confidential
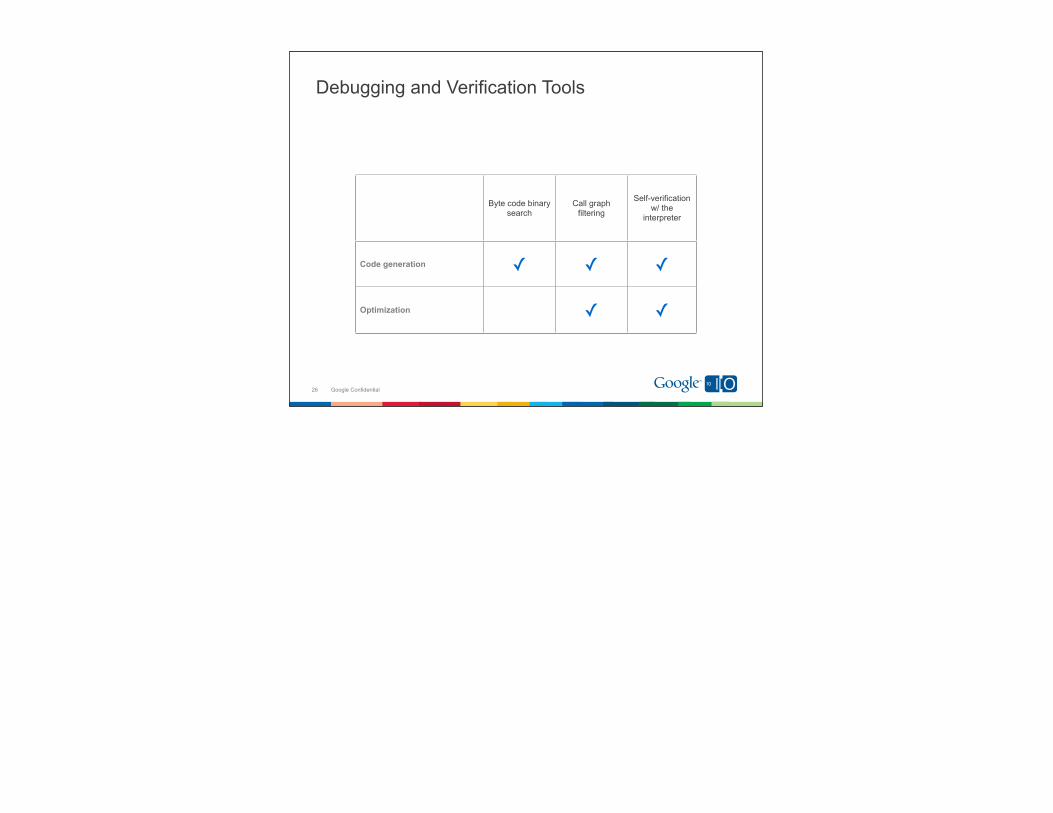
Debugging and Verification Tools
26
Byte code binary search
Call graph filtering
Self-verification w/ the
interpreter
Code generation ✓ ✓ ✓
Optimization ✓ ✓
Google Confidential
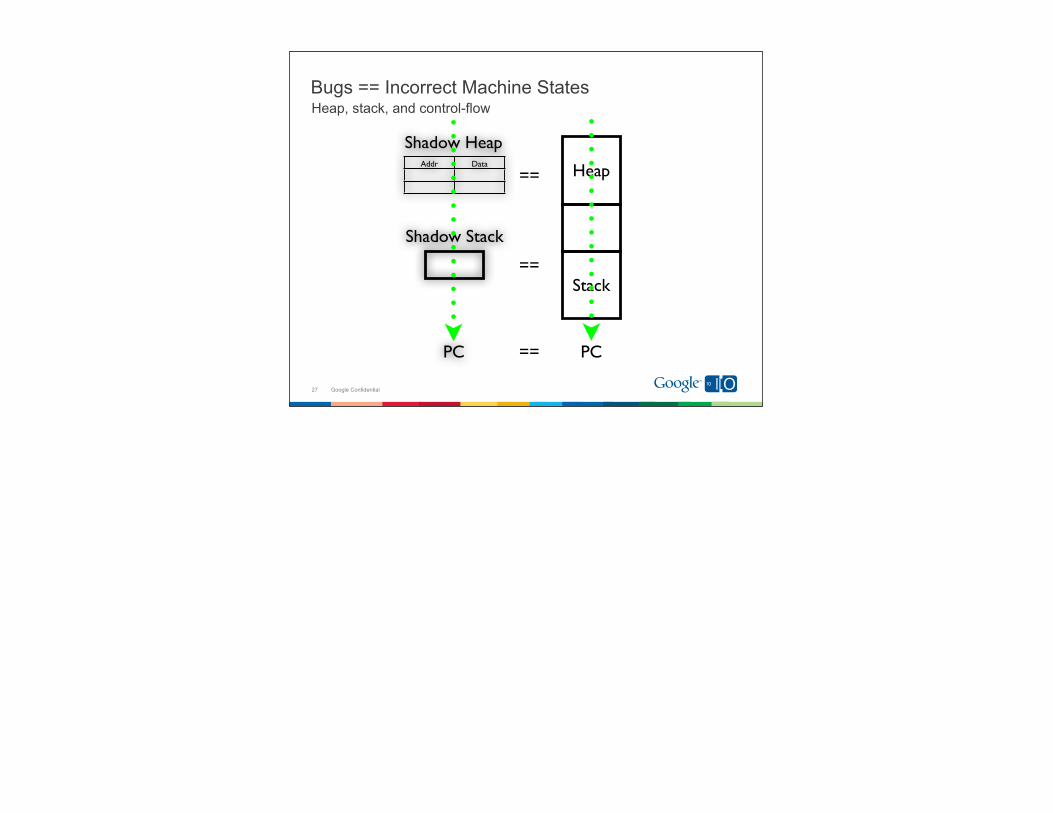
Bugs == Incorrect Machine States
27
Heap, stack, and control-flow
Stack
Heap
PC
Addr Data
Shadow Heap
Shadow Stack
PC
==
==
==
Google Confidential
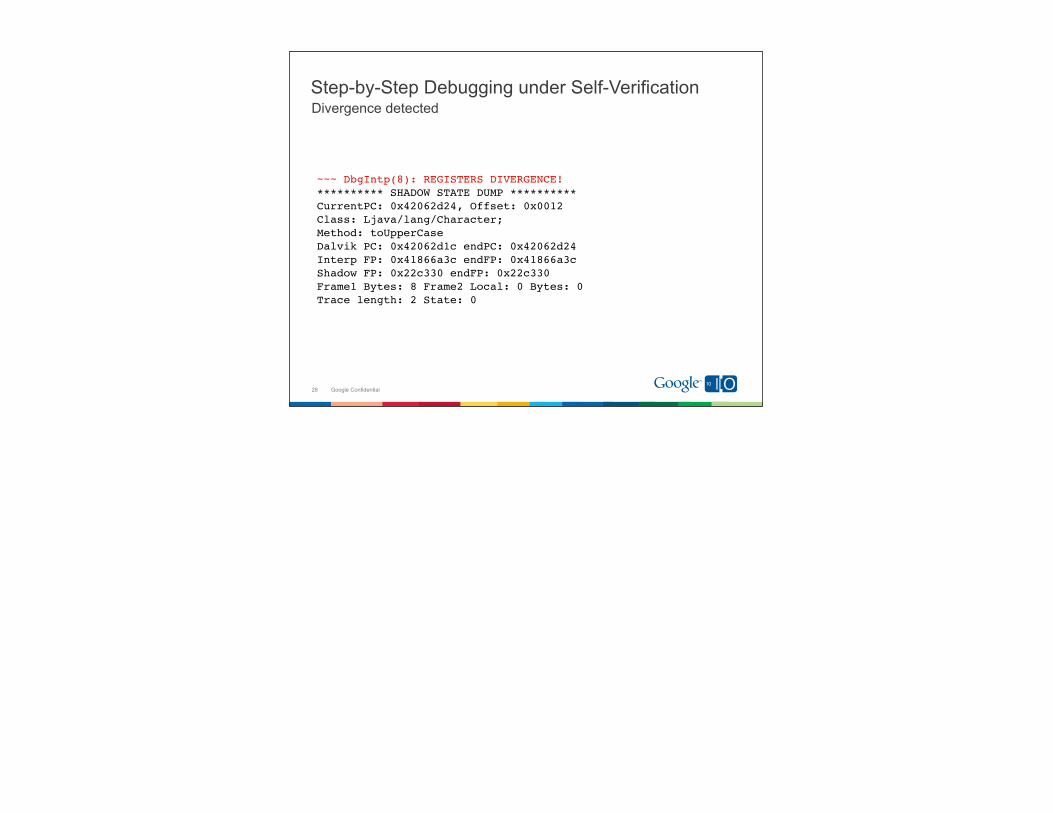
Divergence detectedStep-by-Step Debugging under Self-Verification
~~~ DbgIntp(8): REGISTERS DIVERGENCE!********** SHADOW STATE DUMP **********CurrentPC: 0x42062d24, Offset: 0x0012Class: Ljava/lang/Character;Method: toUpperCaseDalvik PC: 0x42062d1c endPC: 0x42062d24Interp FP: 0x41866a3c endFP: 0x41866a3cShadow FP: 0x22c330 endFP: 0x22c330Frame1 Bytes: 8 Frame2 Local: 0 Bytes: 0Trace length: 2 State: 0
28
Google Confidential
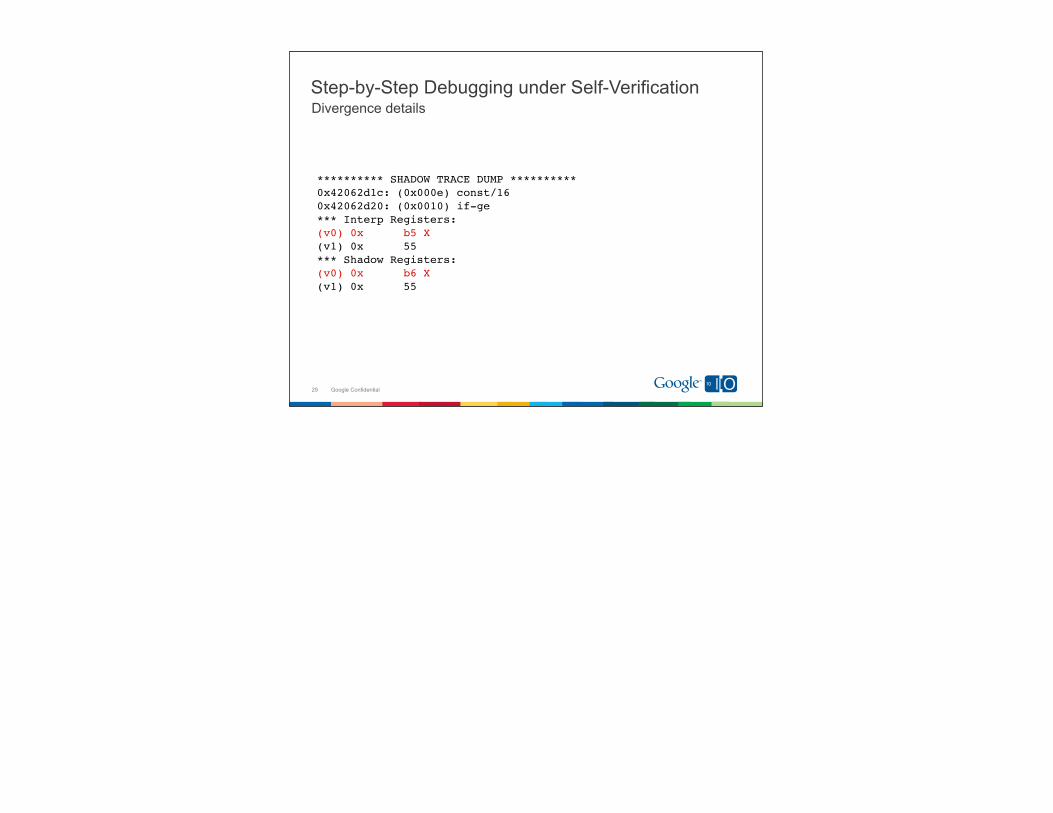
Divergence detailsStep-by-Step Debugging under Self-Verification
********** SHADOW TRACE DUMP **********0x42062d1c: (0x000e) const/160x42062d20: (0x0010) if-ge*** Interp Registers:(v0) 0x b5 X(v1) 0x 55*** Shadow Registers:(v0) 0x b6 X(v1) 0x 55
29
Google Confidential
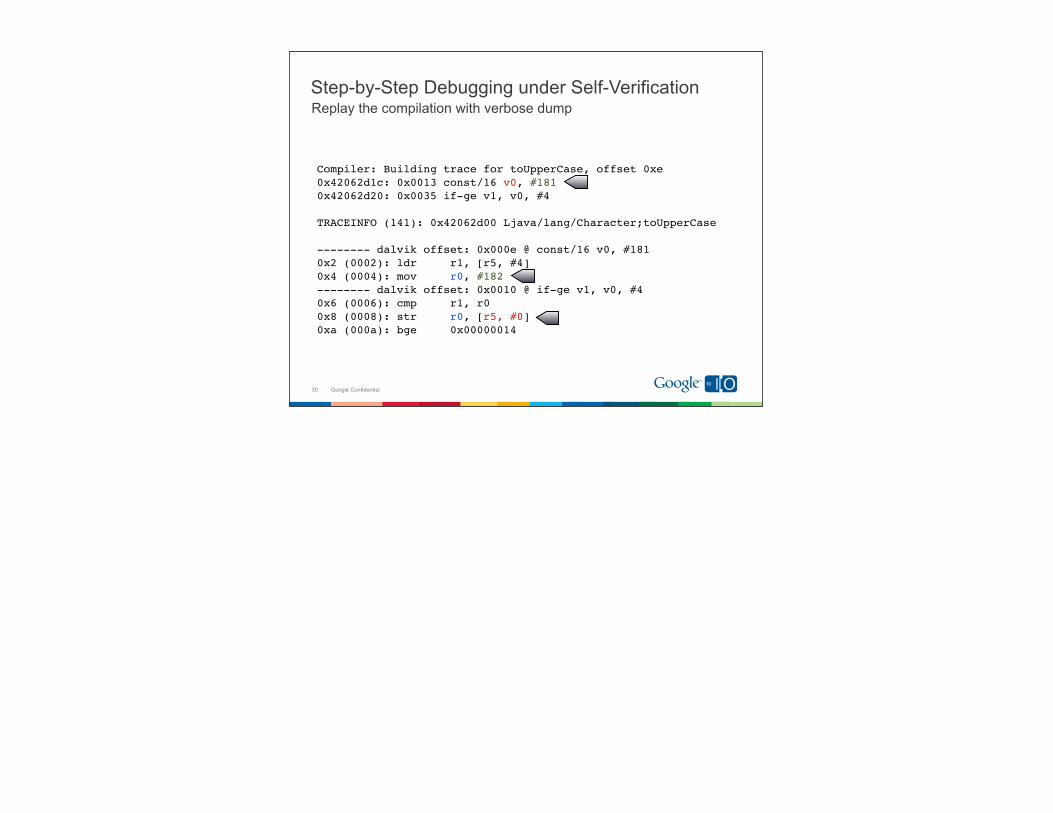
Replay the compilation with verbose dumpStep-by-Step Debugging under Self-Verification
Compiler: Building trace for toUpperCase, offset 0xe0x42062d1c: 0x0013 const/16 v0, #1810x42062d20: 0x0035 if-ge v1, v0, #4
TRACEINFO (141): 0x42062d00 Ljava/lang/Character;toUpperCase
-------- dalvik offset: 0x000e @ const/16 v0, #1810x2 (0002): ldr r1, [r5, #4]0x4 (0004): mov r0, #182-------- dalvik offset: 0x0010 @ if-ge v1, v0, #40x6 (0006): cmp r1, r00x8 (0008): str r0, [r5, #0]0xa (000a): bge 0x00000014
30
Google Confidential
Summary
• A resource friendly JIT for Dalvik– Small memory footprint
• Significant speedup improvement delivered– 2x ~ 5x performance gain for computation intensive workloads
• More optimizations waiting in the pipeline– Enable more computation intensive apps
• Verification bot– Dynamic code review by the interpreter
31
Q&A
• http://bit.ly/bIzjnF
32