© 2007 thomson south-western - plainfield north high...
TRANSCRIPT

© 2007 Thomson South-Western

© 2007 Thomson South-Western
Economic Systems

© 2007 Thomson South-Western
What is an Economic System?
• It’s the method used by society to produce
goods and services

© 2007 Thomson South-Western
The Four Economic Systems
• Traditional Economy
• Market Economy
• Planned/Command Economy
• Mixed Economy

© 2007 Thomson South-Western
Traditional Economy
• Relies on habit, custom, or ritual to make
economic decision
© 2007 Thomson South-Western
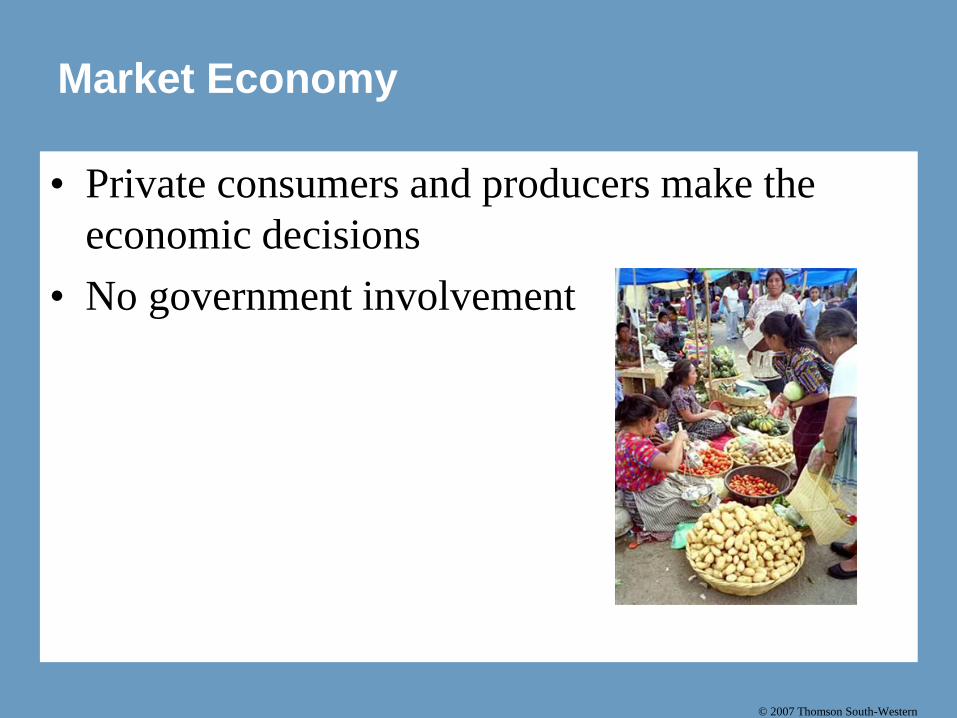
Market Economy
• Private consumers and producers make the
economic decisions
• No government involvement
© 2007 Thomson South-Western
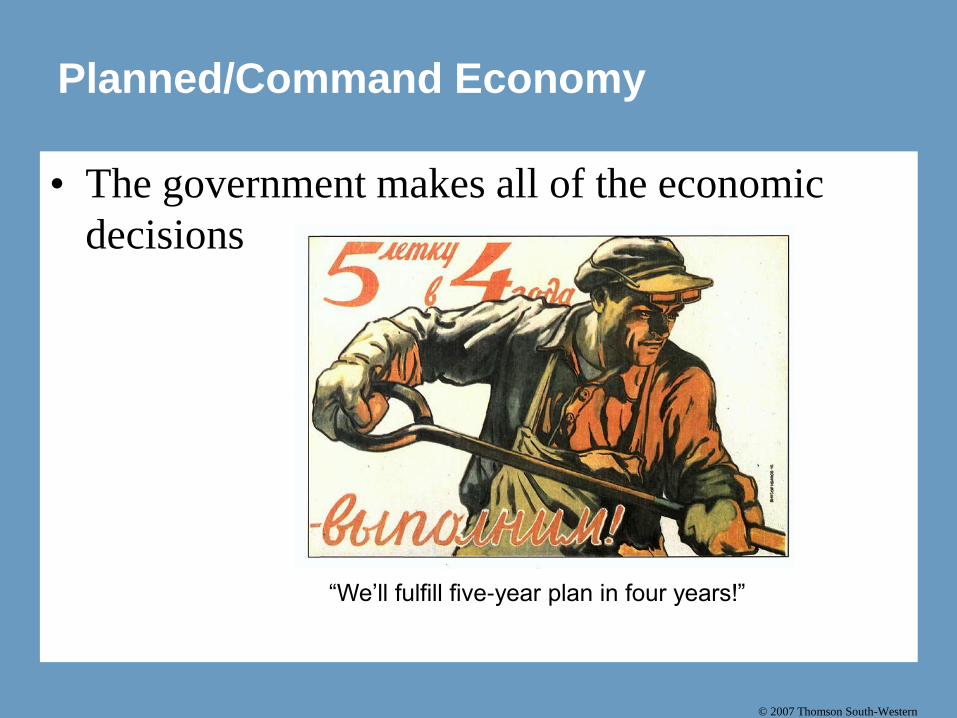
Planned/Command Economy
• The government makes all of the economic
decisions
“We’ll fulfill five-year plan in four years!”

© 2007 Thomson South-Western
Mixed Economy
• Economic decisions are made by both the
government and private consumers/producers.

© 2007 Thomson South-Western
Economic Models

© 2007 Thomson South-Western
Economic Models
• Economists use models to simplify reality in
order to improve our understanding of the
world.
• Two of the most basic economic models are:
• The Circular Flow Diagram
• The Production Possibilities Frontier

© 2007 Thomson South-Western
Our First Model: The Circular-Flow Diagram
• The circular-flow diagram is a
visual model of the economy
that shows how dollars and
resources flow through markets
among households and firms.

© 2007 Thomson South-Western

© 2007 Thomson South-Western
Figure 1 The Circular Flow Model
Spending
Goods andservicesreceived
Revenue
Produced goodsand services
Labor, land,and capital
Income
= Flow of inputs
and outputs
= Flow of dollars
Factors ofproduction
Wages, rent,and profit
FIRMS HOUSEHOLDS
•Households sell
•Firms buy
MARKETS FOR
FACTORS OF PRODUCTION
•Firms sell
•Households buy
MARKETS FOR
GOODS AND SERVICES
© 2007 Thomson South-Western
Our Second Model: The Production Possibilities Frontier
• The production possibilities
frontier is a graph that shows
the combinations of output that
the economy can produce given
the available factors of
production (resources).

© 2007 Thomson South-Western
The Production Possibilities Frontier
Production
Possibilities
Frontier
A
Quantity ofCars Produced
2,200
6000
3,000
1,000
Quantity of
Computers
ProducedThe PPF shows you the
maximum amount of resources
you have for production
If all resources were used, you can
make 3,000 computers and 0 Cars.
Or, you can make 1,000 cars and 0
computers

© 2007 Thomson South-Western
The Production Possibilities Frontier
BA
Quantity ofCars Produced
2,200
600
1,000
3000 700
2,000
3,000
1,000
Quantity of
Computers
Produced
C
A=
B=
C=
D=
E=
Production Efficiency
Production Efficiency
Not possible!
Underutilization
E
Efficiency &
specialization in
car production
Brain Busta!!!
D

© 2007 Thomson South-Western
Our Second Model: The Production Possibilities Frontier
• Concepts illustrated by the production
possibilities frontier
• Allocation of resources
• Opportunity cost
• Economic growth

© 2007 Thomson South-Western
PPF Questions…
BA
Quantity ofCars Produced
2,200
600
1,000
3000 700
2,000
3,000
1,000
Quantity of
Computers
Produced
D
1. What is the opportunity cost of moving
production from point A to point B?
2. What is the opportunity cost of moving
production from point D to point B?
What can cause the PPF to shift?

© 2007 Thomson South-Western
A Shift in the Production Possibilities Frontier
Quantity ofCars Produced
2,200
600
2,300
6500
4,000
3,000
1,000
Quantity of
Computers
Produced
A
G
What do you think would
cause the PPF to shift
this particular way?
Something changed that
caused there to be more
resources in computer
production.